Defect Fix and Resolution Time
Definition and Purpose
Defect Resolution Time (DRT) is a flow metric that measures the elapsed time between the detection of a defect and its verified resolution. It captures how quickly the system can analyze, assign, fix, integrate, and confirm a defect once it has been found.
From a flow perspective, DRT spans two distinct phases:
- Detection to Assignment (red, 1-3) – reflecting organizational responsiveness, clarity of ownership, and triage effectiveness
- Assignment to Resolution (green, 3-5) – reflecting technical execution, feedback speed, integration readiness, and verification efficiency
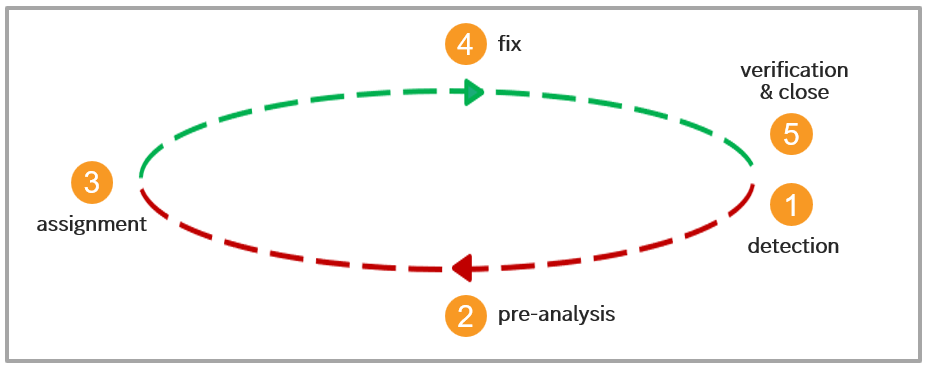
Together, these phases describe the end-to-end defect resolution flow, including triage, assignment, root-cause analysis, implementation, integration, verification, and closure.
Why it Matters
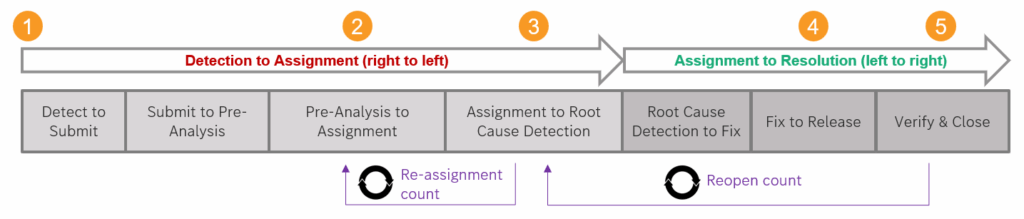
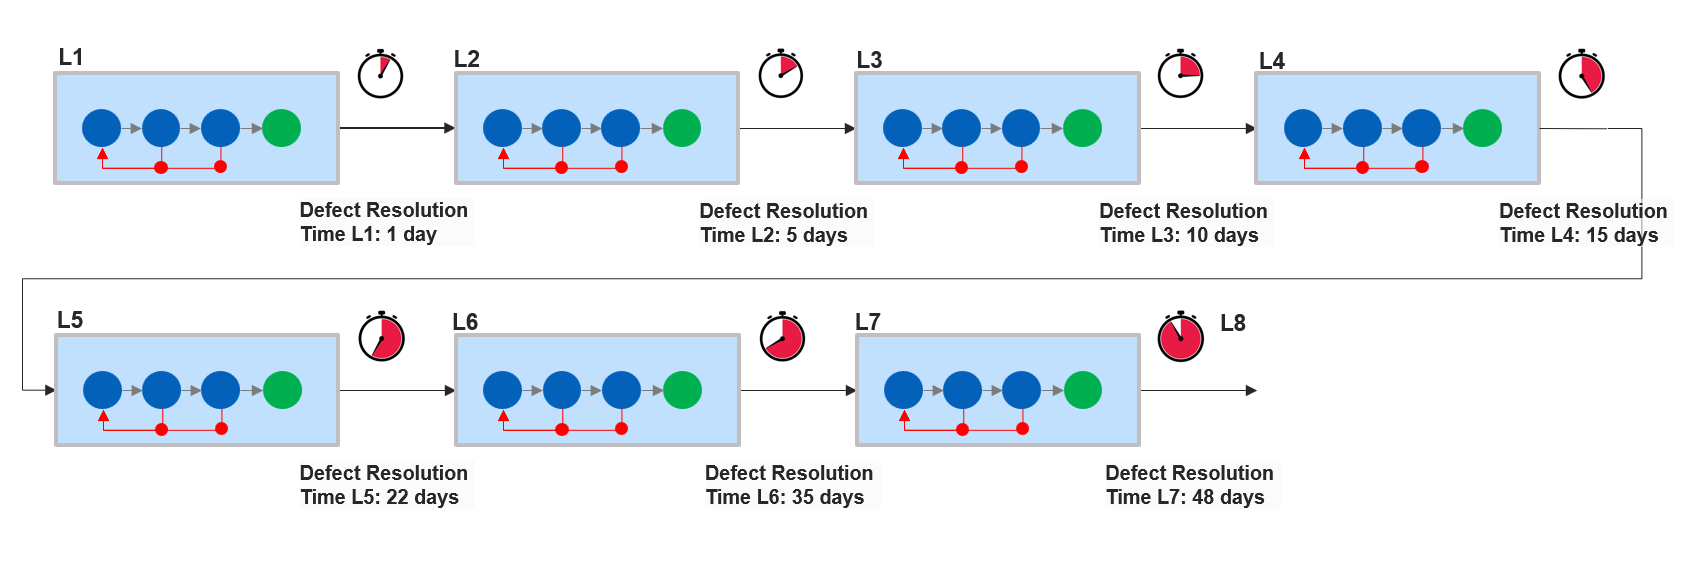
Measuring Defect Resolution Time across the individual phases of the resolution cycle makes visible where time is actually spent from detection to verified closure. By breaking the cycle into its constituent steps (see illustration above), organizations can see where delays accumulate, where work waits in queues, and where hand-offs or coordination slow the system down.
Long resolution times rarely have a single cause. They typically emerge from friction across multiple phases of the cycle: unclear ownership during assignment, repeated re-assignments while responsibility is clarified, slow pre-analysis due to missing or incomplete data, and waiting for integration or test windows. In many cases, the fix itself can also become a significant contributor – especially when it requires coordination across teams, components, or suppliers, or when changes must be synchronized and revalidated at higher integration levels. Costly or delayed verification in downstream stages further extends recovery time.
Metrics such as re-assignment count and reopen count make these inefficiencies visible. They expose coordination problems, quality gaps, and waste within the resolution cycle – showing where learning slows down, flow is interrupted, and the system struggles to return to a stable state.
Viewed this way, Defect Resolution Time is not just a measure of how fast defects are fixed. It is a system-level indicator of flow and recovery capability. It reveals where bottlenecks constrain learning, where work-in-progress accumulates, and where the cost of quality is amplified by delayed feedback and late validation. As such, DRT is a critical signal for improving flow, reducing WIP, and lowering the overall cost of quality.
Reducing DRT delivers clear, systemic benefits:
- Faster feedback and learning, enabling teams to validate fixes sooner
- Lower work-in-progress and defect backlog, improving flow efficiency
- Reduced cost of quality, as defects are resolved before they age, spread, or trigger follow-up issues
- Higher development throughput, as less capacity is tied up in defect handling
Application in Sub-Streams and Very Large Value Streams
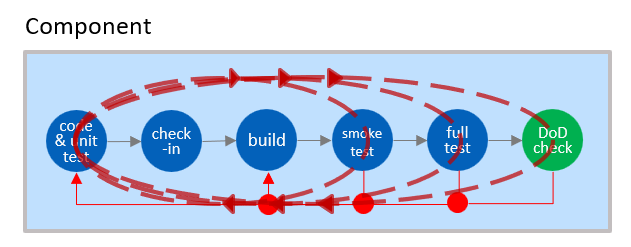
Defect Resolution Time (DRT) can be observed at different scopes and integration levels within a value stream. As illustrated in the component-level view above, the leftmost stages of the value stream – where coding, unit testing, and local validation occur – typically exhibit very short feedback and resolution cycles. Most activities are performed by the same team1, context is fresh, ownership is clear, and coordination effort is minimal. As a result, defects can often be detected, fixed, and verified within tight, localized feedback loops.
As components grow in size or responsibility, and as more people become involved, these feedback loops naturally expand. Even at the component level, additional test stages and hand-offs increase resolution time, but ownership usually remains relatively clear and coordination manageable.
The second illustration shows what happens once multiple components are integrated into a higher-level subsystem or integration stage (L2). At this point, Defect Resolution Time becomes a composite measure. The integration stage has its own average resolution time, but that average masks significant variation across the contributing components.
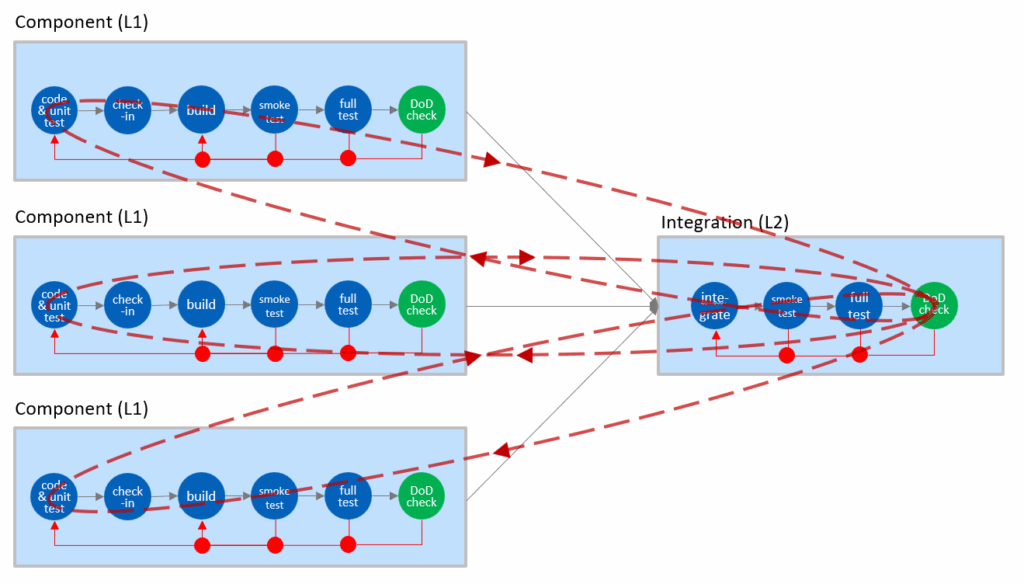
With each additional integration level, feedback loops become longer and more complex. Resolution now depends not only on fixing code, but on coordination across teams, synchronization of releases, availability of integration and test windows, and successful revalidation at higher stages. As a result, DRT increasingly reflects the health of the overall system: clarity of ownership, effectiveness of coordination, integration discipline, and the cost of moving fixes through the value stream.
Viewed through this lens, Defect Resolution Time is not just a local efficiency metric. It reveals how well a value stream manages learning, coordination, and recovery across its different layers – and where expanding feedback loops turn small defects into costly, system-level delays.
While the previous illustration focuses on a single component or sub-product, the same Assembly Line–based concept can be consistently applied across the entire value stream, as shown in the figure below. As a result, teams can improve quality and flow within their own area of responsibility, while leadership gains transparency into system-wide behavior and bottlenecks. Local optimizations are therefore guided and validated in the context of overall value stream performance, ensuring that improvements contribute to end-to-end flow rather than sub-optimizing isolated parts of the system.
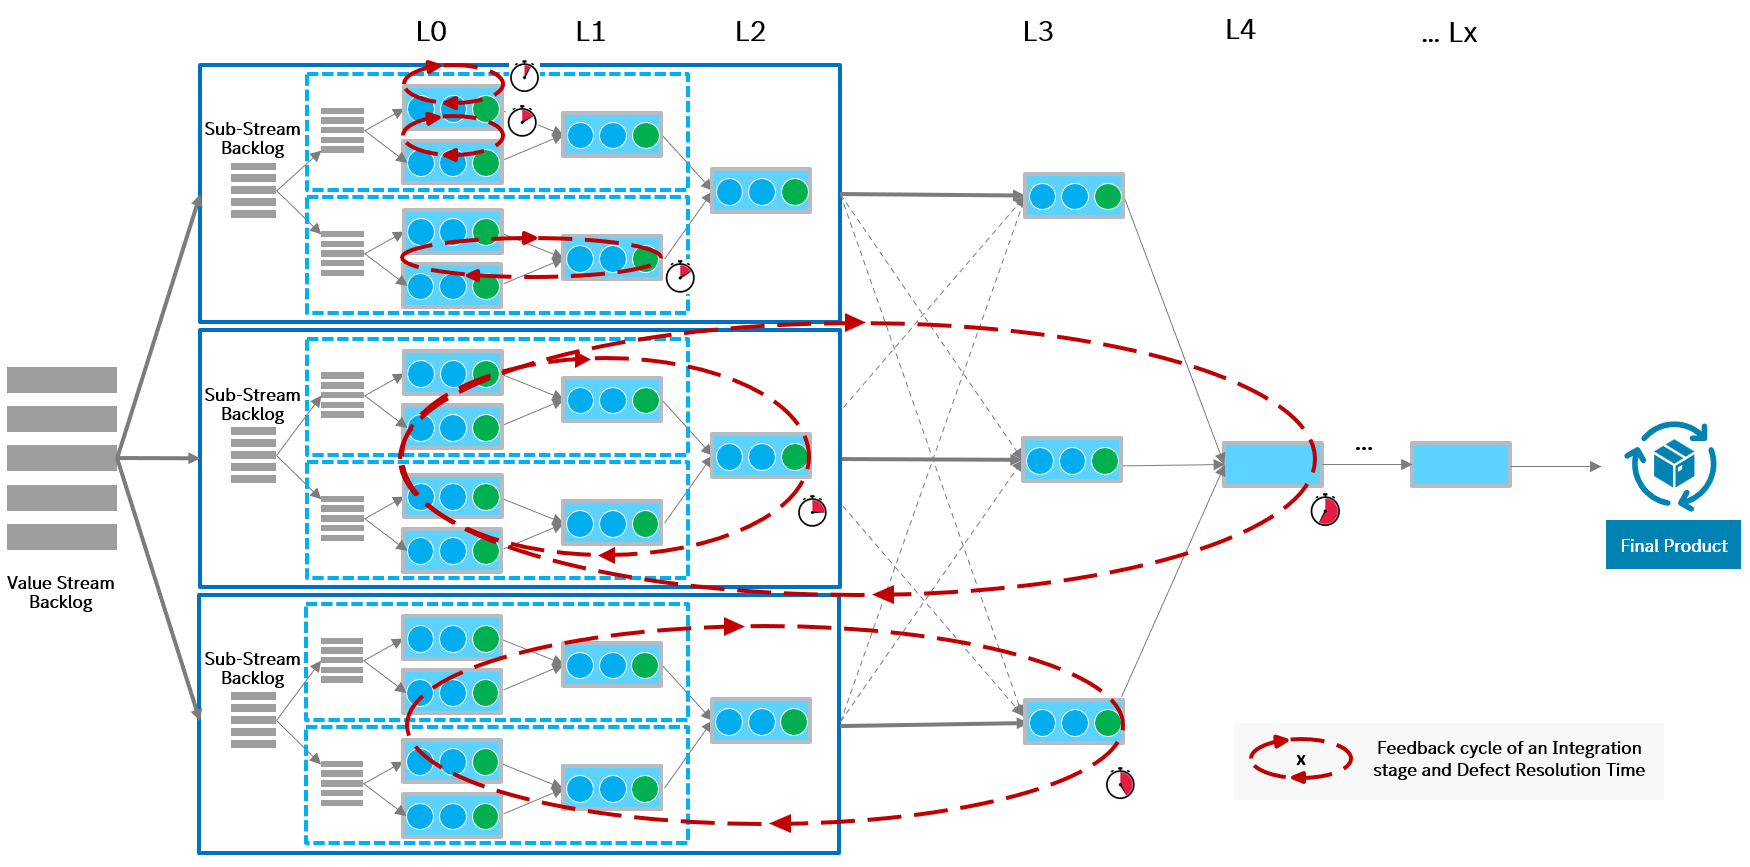
The same Assembly Line–based measurement logic applies from individual components and sub-streams to the full end-to-end value stream, enabling local improvement while preserving system-level optimization.
Measurement Views and Interpretation
Tracking Defect Resolution Time as a single trend is useful as a high-level performance indicator: it shows whether the system is getting faster or slower at recovering from defects. However, this aggregate view offers limited guidance on where or how to intervene. Without phase-level insight, teams often optimize the wrong part of the system.
Breaking Defect Resolution Time into its individual phases makes visible how feedback and recovery actually flow through the Assembly Line. The phase-level view reveals where feedback loops stretch, where work accumulates in queues, and where coordination effort dominates as defects move from detection to verified closure.
These insights turn a monitoring metric into an improvement instrument. By enabling drill-down into each phase – down to the concrete list of defects – teams can analyze patterns, outliers, re-assignments, reopenings, and other anomalies2. Understanding the character and meaning of the data, not just its averages, is essential for identifying true bottlenecks and guiding deliberate system-level improvements that lead to faster, more reliable recovery.
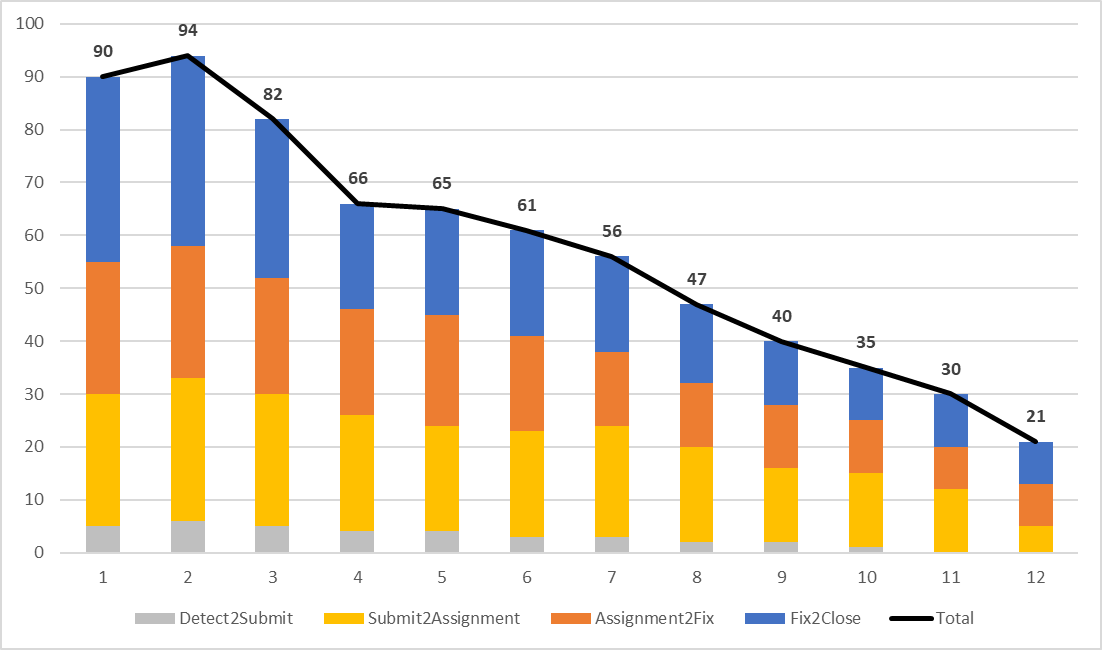
The graph above illustrates an idealized Defect Resolution Time breakdown to support discussion and analysis. In practice, many organizations cannot yet observe all phases explicitly. Limited observability often requires clustering multiple steps into broader phases for reporting, until measurement systems mature and finer-grained insights become available.
- Detection → Submission
This phase represents the earliest feedback loop, where a potential defect is turned into an actionable signal. Long durations typically indicate delayed reporting, manual data collection, or insufficient observability at the point of detection. Improvements focus on better test instrumentation, automated defect creation, clearer reporting standards, and richer contextual data (logs, traces, environment details) captured at detection time.3 - Submission → Pre-Analysis → Assignment
Delays here usually reflect friction in making defects analyzable and routable. Missing context, manual triage, or unclear severity definitions slow feedback, while extended assignment times and frequent re-assignments point to unclear ownership or weak alignment between team topology and the Assembly Line. Effective levers include standardized defect payloads, automated data enrichment, clearer component ownership, and explicit routing rules that make responsibility visible early. In addition, AI-supported triage4 can learn from historical defect records to suggest likely responsible components or teams, flag similar past issues, and highlight missing information – reducing manual effort, limiting defect bouncing, and accelerating assignment without removing human decision authority. - Assignment → Root Cause Detection → Fix
In this phase, feedback reaches those responsible for learning and correction. Long durations often stem from context loss, competing priorities, or cross-team dependencies. The fix itself can be a major contributor when changes require coordination across components, synchronized releases, or supplier involvement. Improvements target better architectural modularity, reduced coupling, preserved context through smaller batches, and collaborative analysis when defects span multiple areas. - Fix → Verify & Close
Delays here signal downstream constraints: infrequent integration, manual release steps, limited test environments, or slow system-level verification.5 Reopen counts often surface in this phase. Typical improvements include increasing integration and deployment frequency, automating pipelines, reducing batch sizes, shifting verification earlier, and strengthening regression coverage and observability.
Viewed as a whole, Defect Resolution Time is not a measure of how fast teams “fix bugs,” but of how effectively the value stream routes feedback, clarifies ownership, enables learning, and restores flow across its Assembly Line. Sustainable improvement comes from addressing delays at the phase where they originate – not from compensating downstream or optimizing isolated steps.
Different Scope & Views in the Value Stream DRT
Defect Resolution Time can be measured at any stage of a value stream. It often makes sense to have specific filters on scope (component or stage), defect type, defects with very long resolution times etc.
References
- While this description assumes work within a single team, the actual feedback loop length depends on how the value stream is organized. For example, component teams, stream-aligned teams, or hybrid team topologies exhibit different coordination patterns and hand-offs. As a result, the concrete process steps and feedback cycle times can vary significantly across organizations and value streams. ↩︎
- In practice, significant insights often emerge from analyzing individual defect records and discussing them with the people involved. Asking simple questions such as “Why did it happen this way?” or “Why was it tracked this way?” frequently uncovers unexpected patterns, hidden constraints, and improvement opportunities that remain invisible in aggregated metrics alone – and often leads to refinements in how data is captured, interpreted, and how the metric itself is defined and measured. ↩︎
- In automotive and similar domains, certain tests – such as outdoor or on-road test drives – are still performed manually and under constrained technical conditions. Limited tool support, lack of connectivity, bandwidth restrictions, or offline environments often delay the availability of test and defect data by days. Investments in enabling technologies – such as improved test tooling, automated data upload, satellite connectivity, or direct over-the-air vehicle connections – can significantly shorten these feedback delays and are often economically justified when compared to the cost of waiting for late data. ↩︎
- Beyond assignment support, additional AI use cases can assist across the defect resolution cycle—for example by identifying recurring patterns, suggesting likely root causes based on historical data, detecting anomalies in resolution times, or highlighting inconsistencies in defect categorization and tracking. Used as decision support, these capabilities can further reduce manual effort and improve learning without replacing human ownership or accountability. ↩︎
- This phase is central to DevOps practices, focusing on building and optimizing delivery pipelines that enable reliable integration, automated validation, and continuous delivery of changes. ↩︎
Author: Peter Vollmer – Last Updated on January 12, 2026 by Peter Vollmer