Value Stream Thinking equips organizations with the models and methods to see, design, and steer how value flows through complex product development systems. Grounded in Lean, Agile, DevOps, and Systems Thinking, this site shares the body of work openly as a space for learning, discussion, and continuous refinement.
The overview picture shows how Value Stream Thinking works as a coherent system – from motivation and modeling through identification, organizational design, optimization, and enterprise-wide steering. Each numbered element represents a key concept explored in a dedicated article. Follow the numbers to navigate the system.

① Model–System Fit – Why Value Stream Thinking?
It all starts with a fundamental insight: traditional value stream methods, rooted in mass production, don’t fit the realities of modern product development. Like using a flat-head screwdriver on a Phillips screw – you can make progress, but the tool doesn’t match the task. Value Stream Thinking provides a purpose-built approach for iterative, feedback-driven, software-intensive and cyber-physical environments.
📖 Why Value Stream Thinking? The strategic case for VST – for leaders, sponsors, and anyone asking “why bother?”
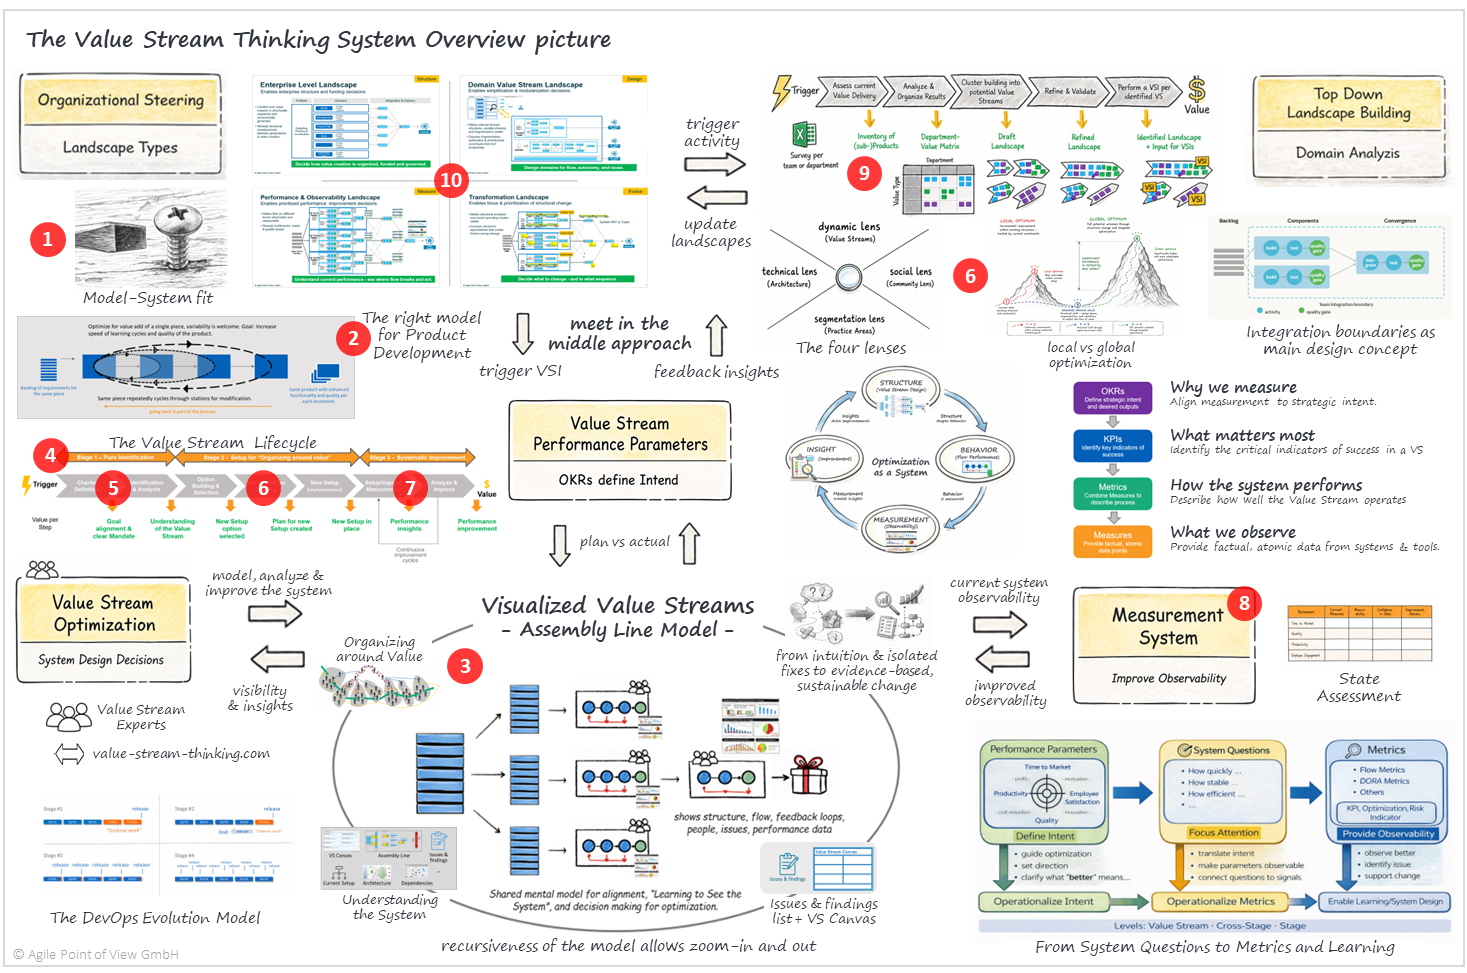
② The Right Model for Product Development – Why the Way You Visualize Matters
The choice of model determines what you see – and what you see determines how you act. Traditional value stream maps assume linear, repeatable flows. But product development thrives on iteration, learning cycles, and feedback. The mass production mindset treats going back as failure; the product development mindset treats it as the engine of progress and innovation. Understanding this contrast is essential before choosing how to model your value streams.
📖 Why the Way You Visualize Value Streams Matters Why the model you choose shapes what you see and how you act – for anyone selecting or evaluating modeling approaches
📖 Value Stream Concepts and Definitions Foundational terminology – Value Streams, Sub-Streams, Landscapes, Domain Value Streams, and the distinction between Operational and Development Value Streams. For anyone new to Value Stream Thinking
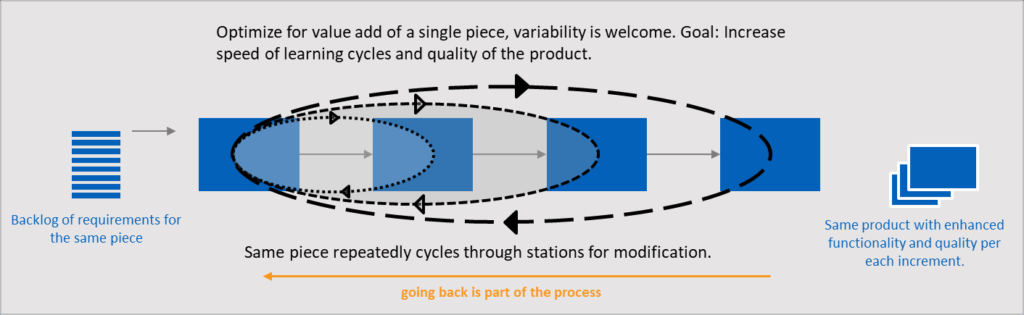
③ Visualized Value Streams – The Assembly Line Model
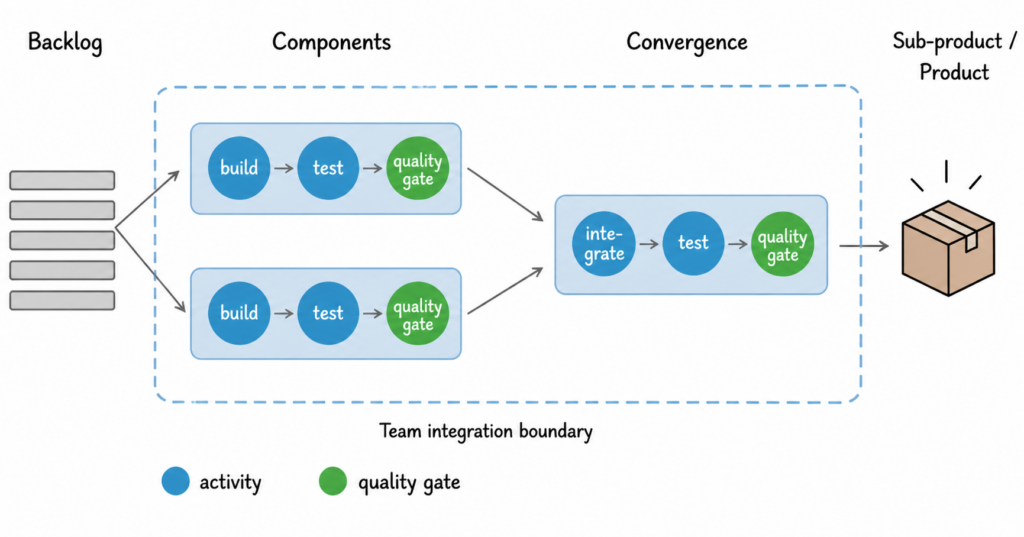
At the heart of Value Stream Thinking sits the Assembly Line Model – a shared mental model for alignment, for learning to see the system, and for making decisions about optimization. It captures feedback loops, integration points, and learning cycles as first-class elements – not as exceptions to a linear flow. It visualizes the structure of a development value stream: what is being built, from which components, through which integration and testing stages, driven by which backlogs. The model makes visible what is usually invisible – flow, dependencies, people, issues, and performance data. It starts simple and grows as needed, and because of its recursive structure, it scales from a single team’s workflow to an enterprise-wide landscape of interconnected value streams. Where traditional maps show a sequence of steps, the Assembly Line reveals a living system – one you can observe, measure, steer, and continuously improve.
📖 The Assembly Line Model – A High-Level Introduction How the model works and what it reveals – for everyone getting started with the Assembly Line
④ The Value Stream Lifecycle

Applying Value Stream Thinking follows a structured lifecycle. It begins with a Trigger – typical reasons include the need to coordinate hundreds or thousands of engineers at scale, a market or strategy shift, a merger or acquisition requiring the integration of systems and product portfolios. Whatever the trigger, the goal is the same: improve the four key performance parameters – Time to Market, Productivity, Quality, and Employee Engagement. These parameters are deeply interconnected; improvements in one often enable or constrain the others, forming a balanced system that reflects both the technical and human aspects of performance. From there, the lifecycle unfolds through three clearly defined stages – each building on the previous and feeding insights back into ongoing improvement cycles:
- Stage 1 – Identification: Understand the value stream: its product, customers, structure, people, current performance, and key issues and constraints. This shared understanding is the basis for Stage 2.
- Stage 2 – Organizing Around Value: Redesign the structure for flow – align teams, boundaries, and ownership to the value stream.
- Stage 3 – Systematic Improvement: Continuously optimize based on evidence: measure, learn, and make deliberate system design decisions.
📖 Value Stream Performance Parameters The four dimensions of value stream performance and how they interact – for anyone defining improvement goals
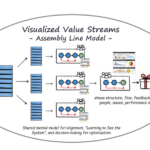
⑤ VST Lifecycle Stage 1: Identification – Understanding the Value Stream
The journey starts with Goal alignment and a clear Mandate – management commits to the initiative, a VSI expert is assigned, and a charter defines the scope and objectives. From there, the core team identifies and analyzes the value stream using three key tools:
- the Value Stream Canvas (a one-page description of the stream’s purpose, customers, and boundaries)
- the Assembly Line Model (a visual map of the current state flow of work, the dependencies and the people involved)
- and the Issues & Findings List (a structured collection of strengths, weaknesses, and improvement opportunities discovered along the way).
The goal is not just to draw a diagram but to build a shared understanding: What is the product, and what value does it create? How many variants, versions, and configurations exist – and does that complexity still serve the customer, or has it become a legacy burden? Who is the customer, and where exactly is value handed over? How does work actually flow – including the handoffs, delays, dependencies, and feedback loops that usually remain hidden? This understanding is the foundation for everything that follows.
📖 Value Stream Identification What VSI is and why it matters – for leaders and sponsors
📖 Assembly Line for Value Stream Identification How to build the model step by step – for facilitators and practitioners
📖 What is in the Blue Boxes? Deep dive into stage modeling: activities, quality gates, and feedback cycles — for modelers and engineers
📖 Variant Management Versions, variants, and configurations – when product complexity becomes a strategic question – for portfolio and product managers, architects, and leaders
⑥ VST Lifecycle Stage 2: Organizing Around Value – Designing the New Setup
Visibility alone does not create improvement. Many organizations experience a persistent gap between effort and outcome: teams work at full capacity, yet delivery takes longer than expected, integration issues surface late, and dependencies dominate planning. The root cause is often structural – responsibility is fragmented across functions, no one owns the end-to-end outcome, and each unit optimizes locally while the overall system suffers.
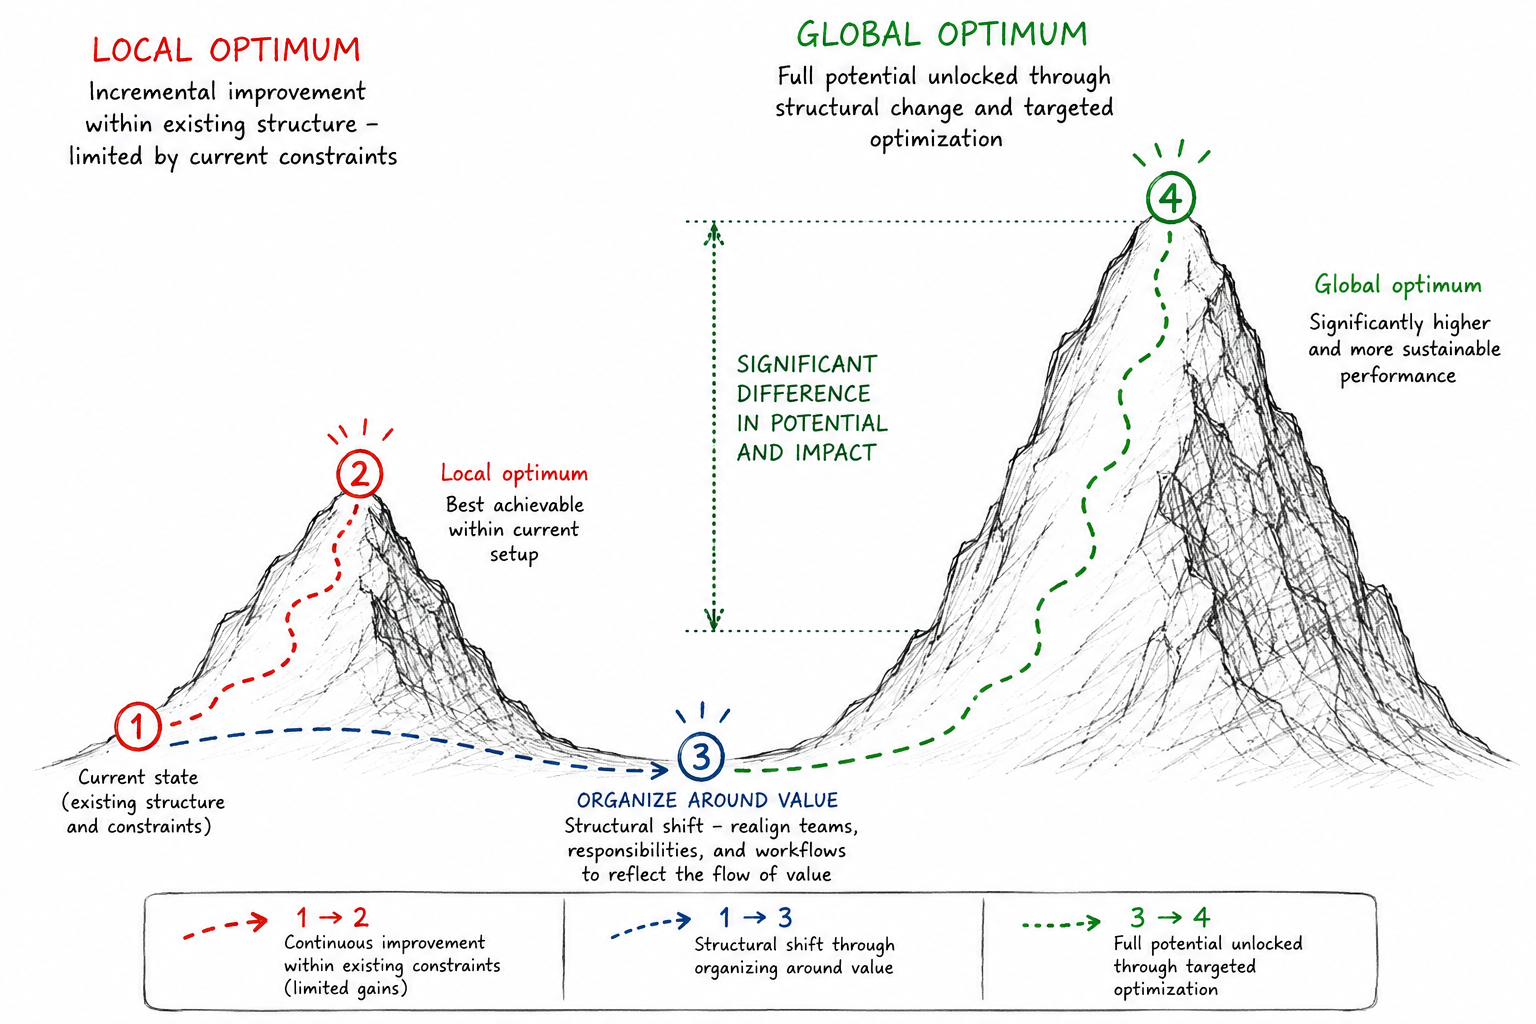
The critical next step is therefore not to try harder within the current structure, but to envision a future state – a redesigned value stream that addresses these structural constraints. Continuous improvement within the existing setup can only reach a local optimum. Organizing around value is a structural shift that moves the organization to a fundamentally better starting point, unlocking the path toward a global optimum where performance gains are significantly higher and more sustainable.
This redesign operates at two levels. At the micro level, the team is recognized as the smallest organizational unit capable of sustaining integration. A properly designed team combines cross-disciplinary capability, shared ownership, decision authority within clear boundaries, and manageable cognitive load – turning integration from an externally coordinated activity into an internal property of the delivery unit. At the macro level, most products exceed the scope of a single team. Designing organizations around value therefore means composing systems of teams – deciding where to place integration boundaries, how to organize work within them, and how to coordinate across them so that the system continues to converge reliably.
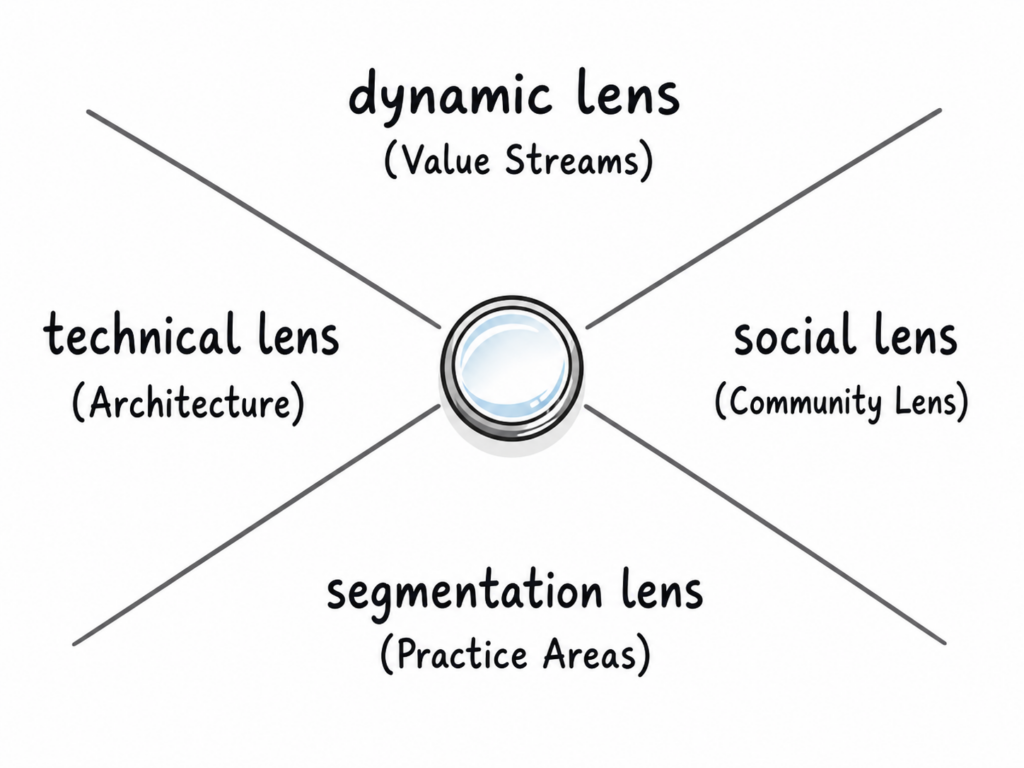
The four structural lenses guide these decisions: the dynamic lens (value stream flow – where work waits and feedback slows), the segmentation lens (fracture planes – where natural splitting points allow coherent team boundaries), the technical lens (architecture – where dependency density determines integration cost), and the social lens (Conway’s Law – where communication structures shape system structure). The stages of the Assembly Line define these integration boundaries – each following the same recursive pattern of backlog, activities, quality gate, and pull – scaling from team level to sub-stream to the entire value stream. Sustainable flow emerges only when all four perspectives are balanced in the resulting structure.
The stage culminates in a Decision Meeting where future-state options are evaluated, a Roadmap for implementation, and the actual Implementation of the new setup – including team formation, role assignment, and working model definition.
📖 Organizing Around Value Why structural alignment is a prerequisite for global optimization – the utilization trap, fragmented responsibility, and the case for redesign – for leaders and organizational designers
📖 The Team as the Smallest Unit of Value Delivery Why the team – not the individual – is the fundamental integration boundary in complex product development – for leaders, team designers, and coaches
📖 Designing Organizations Around Value The four structural lenses, integration boundaries, and systems of teams – a design discipline for complex environments – for organizational designers, architects, and transformation leads
📖 How to Start Decision meeting, roadmap, and implementation steps – for facilitators and project leads
⑦⑧ VST Lifecycle Stage 3: Systematic Improvement – Performance-Driven Optimization
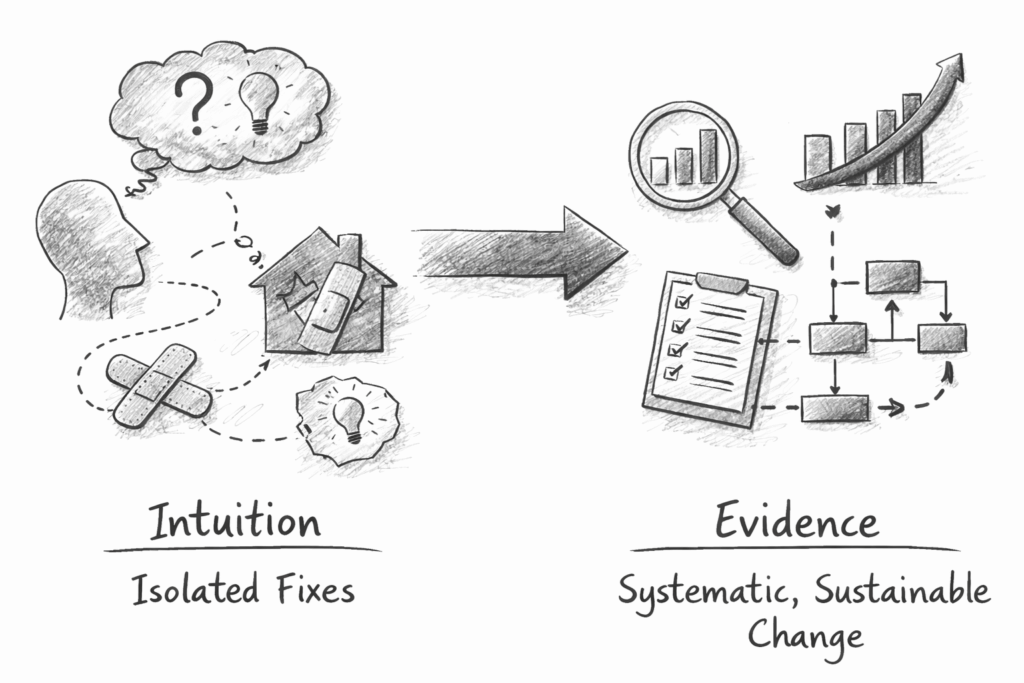
Once the new setup is in place, the focus shifts to continuous, systematic improvement of the value stream or complete landscapes. The goal is to shift from intuition and isolated fixes to evidence-based, sustainable change: improving flow, reducing bottlenecks, strengthening feedback loops, and raising quality over time.
This stage is where the Assembly Line shifts from a visualization tool to an optimization engine – structurally placing measurement observers at every level to make performance visible and actionable.
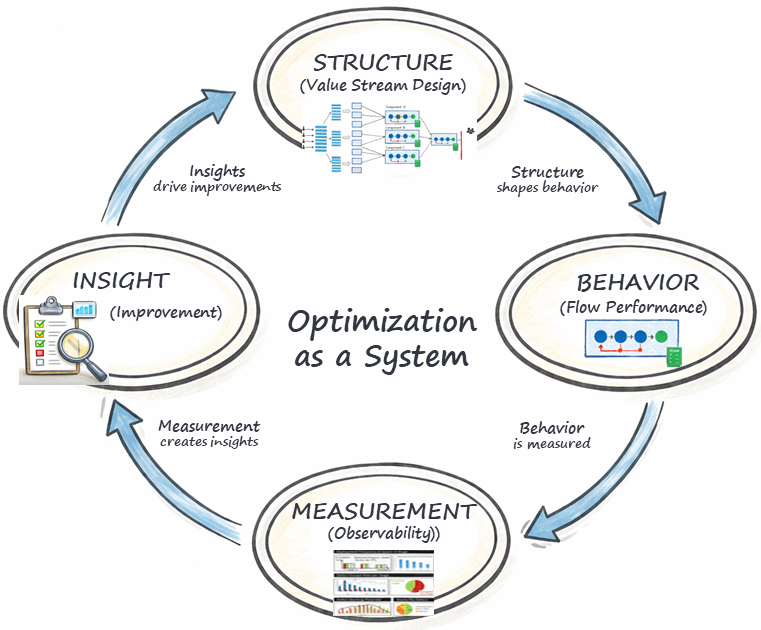
Optimization works as a continuous cycle of four interconnected elements: Structure defines the initial value stream design – how work is organized, integrated, and delivered, including the way of working: the procedures, events, and cadences that bring the structure to life. That structure and way of working together produce Behavior – the actual performance of the system in motion. Measurement makes this behavior observable through metrics, signals, and data points. And from measurement comes Insight – the understanding of what works, what doesn’t, and where to intervene. Insight then feeds back into Structure and way of working, driving deliberate design changes that start the cycle again. This is not a one-time pass but a permanent loop: each iteration sharpens both the system and the organization’s ability to see and steer it.
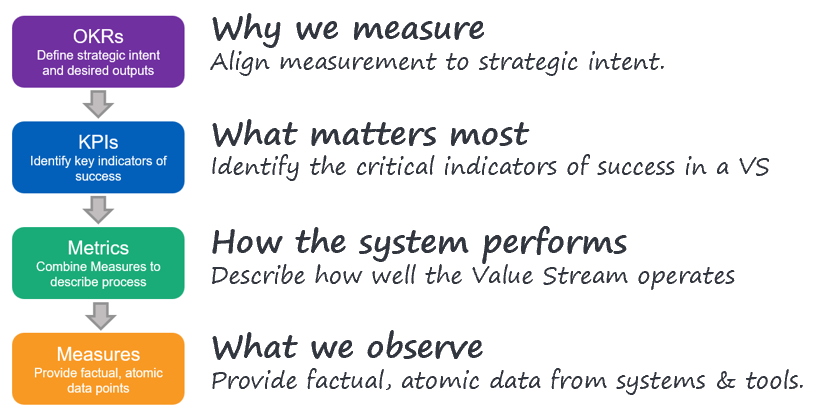
The Measurement System ⑧ is the enabling infrastructure for this cycle. It connects strategic intent with operational reality by translating the performance parameters into a hierarchy of OKRs (defining what “better” means), KPIs (tracking ongoing system health), Metrics (describing how the system performs), and Measures (providing the raw, factual data from tools and processes). Building this system is itself an iterative effort – assessing what data exists, defining the desired future state, and incrementally improving data quality, tooling, and trust in the results.

To guide where and what to measure, a set of system questions provides focus: How efficiently does the value stream deliver? How stable and reliable is delivery? How quickly are problems detected and resolved? Where does work accumulate? Where is feedback delayed or ineffective? These questions are answered by complementary metrics – such as Flow Metrics, DORA metrics, and Assembly Line-specific diagnostics – positioned along the stages, handovers, and feedback loops of the model.
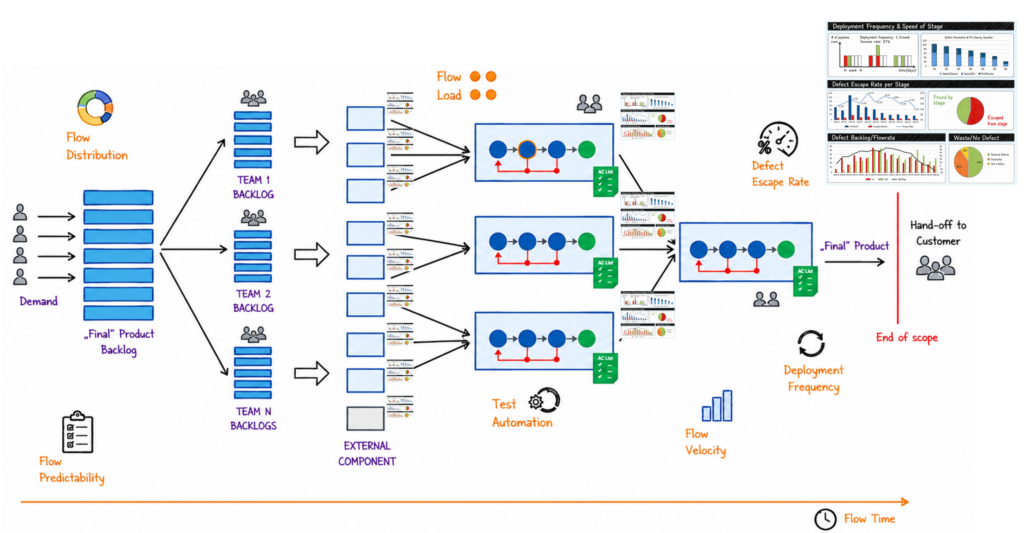
At the value stream level, metrics act as outcome-oriented KPIs for steering; at the cross-stage and stage level, they become diagnostic signals that explain causes and guide targeted improvement. At the beginning, the ability to measure is often limited – so optimization is not just about improving the value stream for better performance but also about improving observability itself: the better we see, the better we can act.
📖 Assembly Line for Value Stream Optimization The mindset, principles, and levers for systematic optimization – shift left, cycle frequency, waste elimination, and the DevOps Evolution Model. For practitioners, optimization leads, and engineering leaders
📖 The DevOps Evolution Model The stages of DevOps maturity – how undone work progressively moves into the Definition of Done as organizations evolve their delivery practices. For engineering leaders and improvement leads
📖 Value Stream Measurement How to design and build a measurement system from strategic intent to operational data – built iteratively like a product. For measurement architects, improvement leads, and sponsors
📖 Metrics Guidance System questions, complementary metrics, and their placement along the Assembly Line – including the relationship to DORA and Flow Metrics. For practitioners and data-driven teams
A growing set of deep-dive articles explores individual metrics in detail – how they work as system-level indicators, where to measure them along the Assembly Line, and what they reveal about flow, quality, and recovery:
📖 Feedback Cycle Times per Stage and Defect Types How feedback speed, cost, and diagnostic power vary across stages — shaping test strategy, shift-left decisions, and quality economics
📖 Deployment Frequency – A Flow and Learning Indicator Deployment Frequency as a system-level metric for meaningful feedback — extended beyond production to stage-level handoffs and integration points
📖 Defect Escape Rate – A System-Level Quality Indicator Defect Escape Rate as a leading indicator for upstream quality, test strategy effectiveness, and end-to-end flow optimization
📖 Defect Resolution Time – A Flow and Recovery Indicator Recovery speed, coordination effectiveness, and downstream flow — with phase-level breakdowns exposing bottlenecks and cost-of-quality drivers
📖 Defect Backlog & Flow Rate – A System Stability Indicator How defect inflow and outflow shape backlog growth, system load, and recovery behavior — revealing systemic imbalance and delayed feedback
📖 Duplicate Defects and Ticket Waste – A Flow Efficiency Indicator Duplicate defects and non-defect tickets as sources of flow waste — using the Non-Defect Ratio to localize waste and strengthen end-to-end flow
⑨ Scaling Value Stream Thinking – Working with Large & Complex Value Streams
Most products of significant scale involve hundreds or thousands of engineers across multiple domains, locations, and organizational layers. Approaching this as a single mapping exercise doesn’t work – the scope is too large, the complexity too high, and the organizational learning too slow. Instead, scaling Value Stream Thinking requires an intentional two-path strategy: a global path and a local path that converge over time.
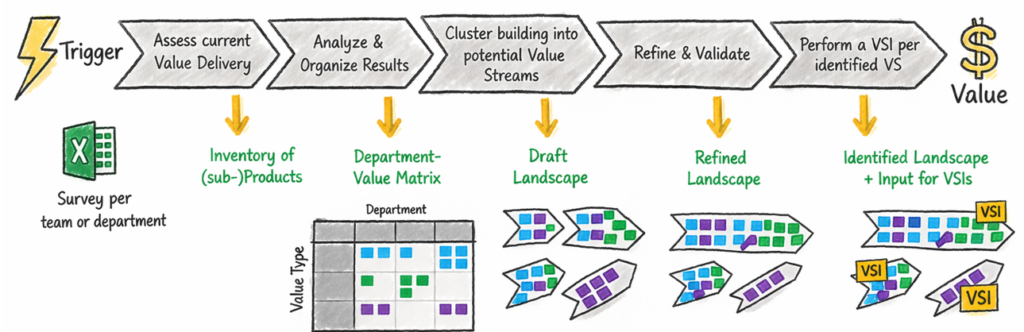
The global path works top-down: a central team develops a high-level Value Stream Landscape across the organization – assessing current value delivery, inventorying products and departments, clustering them into potential value streams, and refining the landscape through validation. This provides strategic structure, alignment, and the input for prioritizing where to conduct detailed Value Stream Identifications.
The local path works bottom-up: focused VSI efforts in selected areas produce actionable insight and early wins. These single identifications generate detailed Assembly Line models, uncover issues, and build organizational capability – one value stream at a time.
The critical principle is “meet in the middle”: the global path learns from local experiences – capturing patterns, aligning the big picture with on-the-ground findings, and establishing guidelines to steer the effort. The local path provides feedback on the practicality of global guidance and surfaces the real structural complexity that only becomes visible at the detail level. Over time, both perspectives converge to form an evolving, increasingly complete picture of how value truly flows – and how alignment, coordination, and convergence are managed properly.
Scaling also requires organizational commitment: allocating the right people and capacity, ensuring active leadership support, and embedding Value Stream Thinking within the broader transformation initiative. This is not a side project – the goal, vision, and roadmap for building the value stream landscape must be integral to the organization’s change strategy.
📖 Working with Large & Complex Value Streams The two-path strategy for scaling VST – global landscape building, local VSIs, and the meet-in-the-middle principle. For enterprise architects, transformation leads, and portfolio management
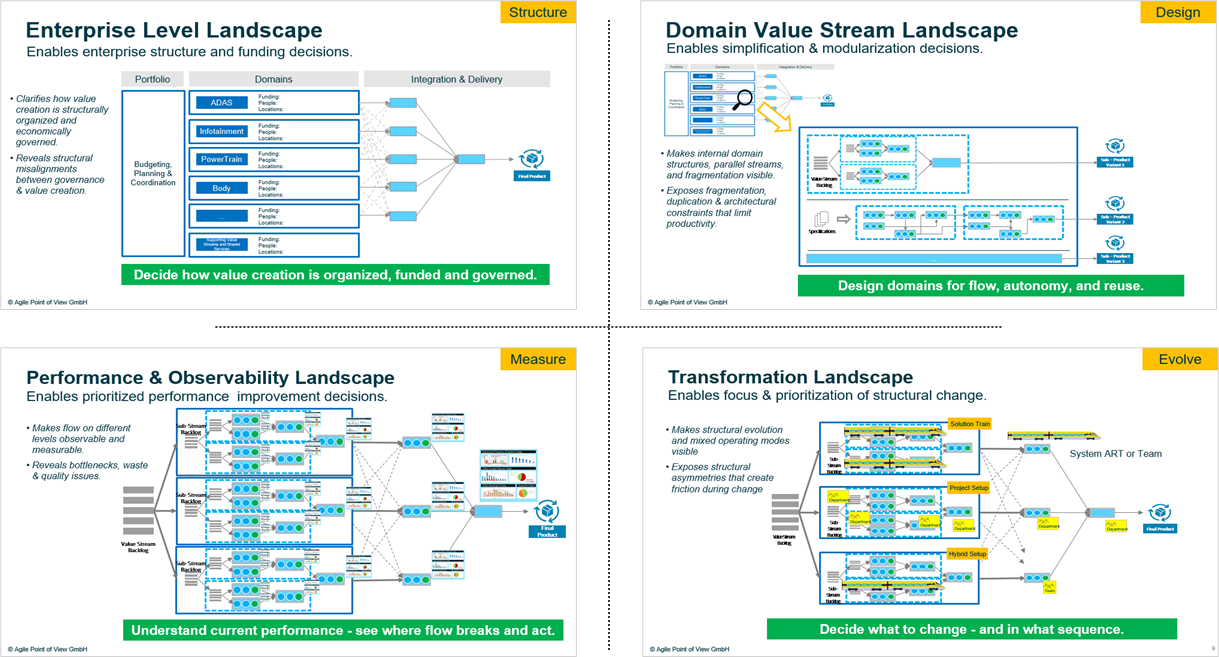
⑩ Organizational Steering – Value Stream Landscapes
No single representation can adequately explain or steer a complex development system. Questions about enterprise structure require a different view than questions about domain productivity. Delivery performance demands a different perspective than structural evolution. Value Stream Landscapes address this by providing four purpose-driven views of the same underlying system – not alternative realities, but deliberate lenses designed to enable specific decisions.
Enterprise Level Landscape – Structure: Decide how value creation is organized, funded, and governed. Makes structural and funding boundaries explicit. It clarifies which Domain Value Streams exist, how responsibilities and budgets are distributed, and where system-level integration and coordination occur. This perspective exposes systemic misalignments – such as domains funded in ways that contradict their obligations, or integration responsibility without clear ownership.
Domain Value Stream Landscape – Design: Design domains for flow, autonomy, and reuse. Reveals the internal structure of a domain: how work is decomposed into sub-streams, how variants and generations are handled, and where architectural coupling or fragmentation limits productivity. This perspective enables simplification and modularization decisions – consolidating parallel streams, reducing variant-driven fragmentation, and aligning team structures with value-aligned flow.
Performance & Observability Landscape – Measure: See where flow breaks – and act. Turns structure into observable system behavior. By anchoring measurement to value stream stages, integration points, and feedback cycles rather than to organizational units, performance becomes comparable across domains. This perspective makes end-to-end flow visible and steerable – revealing queues, late integration, defect escape, and coordination overhead.
Transformation Landscape – Evolve: Decide what to change – and in what sequence. Makes structural evolution and mixed operating modes visible. In large organizations, transformation rarely happens uniformly – some areas operate product-oriented while others remain project-driven, new architectures coexist with legacy generations, and different domains transform at different speeds. This perspective exposes the structural asymmetries that create friction during change and enables deliberate sequencing of transformation steps.
Each perspective makes different relationships visible. None is sufficient on its own. Together, they shift Value Stream Landscapes from descriptive artifacts to practical steering instruments – enabling leadership to connect structure, behavior, and evolution into a coherent decision framework.
📖 Understanding, Designing, and Steering Value Streams at Enterprise Scale The four landscape perspectives – enterprise structure, domain design, performance observability, and transformation steering. Although illustrated with automotive examples, the principles apply to any complex, multi-domain product development system. For senior leaders, enterprise architects, and transformation leads
Author: Peter Vollmer – Last Updated on May 20, 2026 by Peter Vollmer