Duplicate Defects and Other Forms of Ticket Waste
Definition and Purpose
A defect ticket is not a defect. A ticket represents an assumption that something in the product or system is wrong. Someone observed behavior that looked like an anomaly and reported it. Only after analysis, reproduction, and – ultimately – a verified fix does a ticket qualify as a real defect.
In real-world development environments, a significant share of submitted defect tickets never result in a product change. After investigation, they are typically closed under classifications such as:
- Duplicate – the issue was already known or fixed
- No defect – expected or correct behavior
- Not reproducible – insufficient information or unstable conditions
- Outside responsibility – third-party, supplier, or external system
- Other classifications – depending on local process conventions
Empirical data from large development environments shows that this is not a marginal phenomenon. In typical distributions, more than half of all closed defect tickets fall into non-defect categories – most prominently duplicate defects and “no defect” classifications.
Why it Matters
Defect tickets – whether they result in a fix or not – consume real system capacity. They flow through the same intake, prioritization, analysis, and coordination mechanisms as real defects.
- Triage and prioritization
- Root-cause analysis and reproduction attempts
- Cross-team coordination and clarification
- Communication, documentation, and closure
This work competes directly with the handling of real defects and value-creating changes. As non-defect tickets accumulate, queues grow, feedback cycles slow down, and attention is diverted away from issues that actually improve the product.
Even though non-defect tickets terminate without a product change, they degrade overall system flow by increasing load, delaying feedback, and inflating coordination effort across the value stream.
From a Value Stream perspective, non-defect tickets represent pure waste: effort that consumes capacity without contributing to customer value, product quality, or system capability.
Why Non-Defects Exist (Systemic Causes)
Explicitly identifying non-defects serves to improve signal quality in the defect intake process. An optimized value stream is designed to surface signals early while continuously improving their quality.
High non-defect rates indicate systemic friction in how defects are discovered, described, and enter the value stream.
Typical root causes include:
- Unclear defect reporting criteria – leading to inconsistent interpretation of what qualifies as a defect
- Missing diagnostics, logs, or environment information1 – increasing investigation effort and reducing reproducibility
- Late or noisy feedback from downstream stages2 – causing issues to surface detached from their origin
- Insufficient visibility of already known issues3 – resulting in duplicate reporting
- Lack of alignment in test strategy and test execution planning across stages – causing the same underlying issue to be detected and reported independently at multiple points in the value stream
These patterns are driven primarily by the design of feedback loops, information flow, and incentive structures; individual behavior follows these conditions and reinforces their effects.4
When left unmanaged, non-defects inflate defect backlogs, increase queues, slow down feedback cycles, and raise Defect Resolution Time – even for real defects.
How to Measure Ticket Waste
Measuring ticket waste means making visible how defect-handling capacity flows through the value stream, and how much of that flow does not result in a product change.
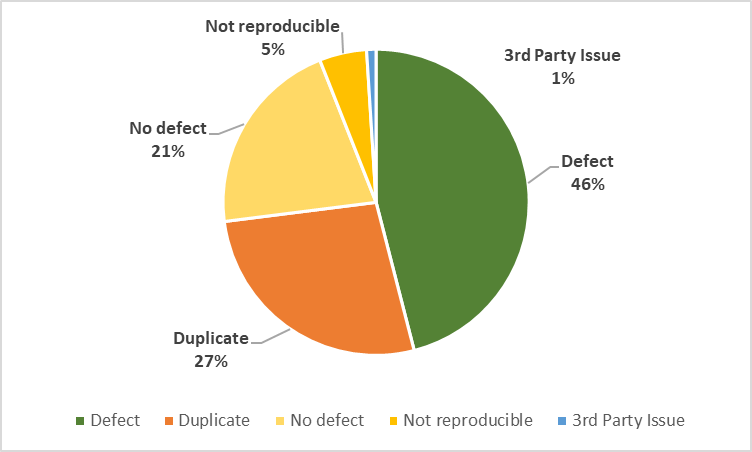
The first and simplest view is the system-level Non-Defect Ratio. It describes the proportion of submitted defect tickets that do not result in a verified fix. Typical non-defect outcomes include duplicates, no defect, not reproducible, or outside responsibility.
At this level, the metric answers a single question: How much of the defect-handling flow does not contribute to product improvement?
The accompanying diagrams illustrate this perspective through the overall ticket distribution over time. The stacked bars show how the composition of tickets changes while the overall reporting volume remains stable. The comparison between January and December highlights that reductions in ticket waste are achieved through improved signal quality.
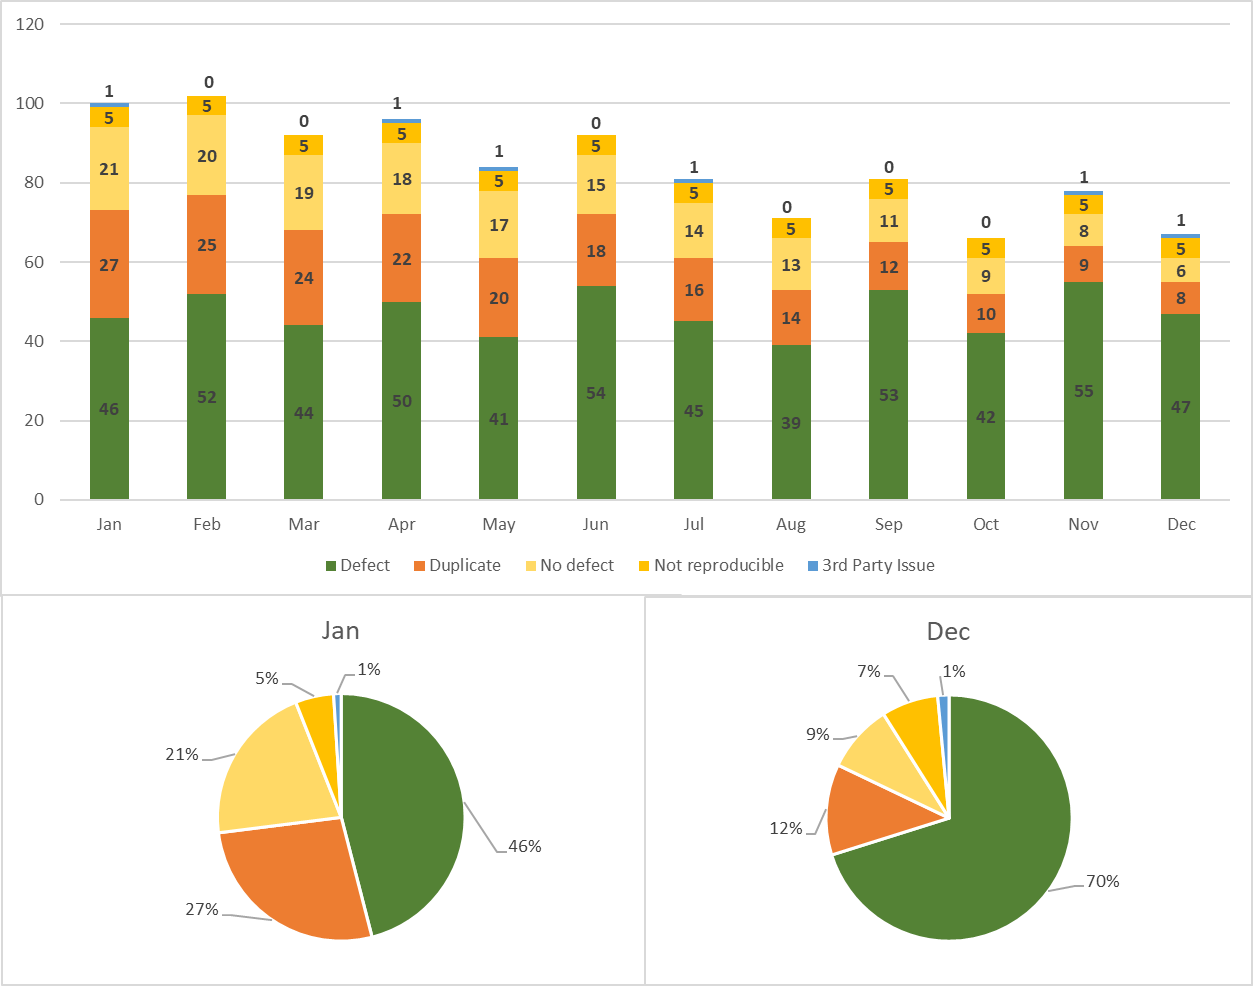
This system-level view provides orientation and trend visibility, but it does not yet explain where waste originates or why it occurs.
Once a stable system-level signal exists, observability can be increased by distinguishing major non-defect categories.
In many environments, duplicate defects form the largest and most actionable share of non-defect tickets.5 Tracking the proportion of duplicates therefore provides a natural next step in understanding ticket waste. Other categories, such as no defect or not reproducible, can be added as visibility improves. The goal is not exhaustive categorization, but progressively sharper resolution of the dominant waste patterns, balanced against the cost and reliability of the data.
At early stages, classification quality may be inconsistent. For this reason, changes in trends and relative proportions are more meaningful than exact values.6
In larger value streams, system- and category-level views are insufficient to understand how ticket waste enters and accumulates.
Breaking down non-defect tickets by discovery stage, test level, or value stream segment makes it possible to localize waste along the Assembly Line. Each stage contributes its own share of non-defect signals, shaped by local feedback loops, visibility, test strategy, and incentives.
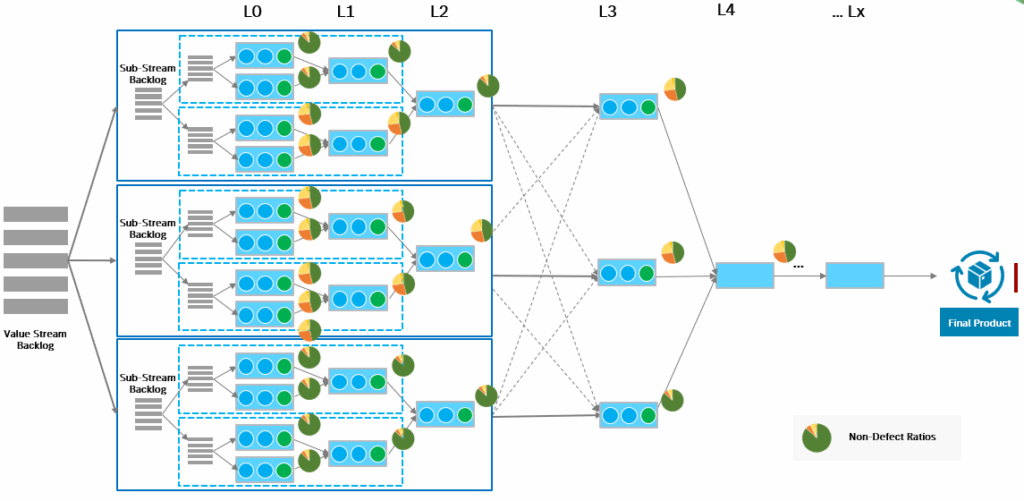
Each stage in the value stream contributes its own share of non-defect tickets. These shares are not uniform and typically concentrate at specific stages, interfaces, or handover points.
The diagram highlights where non-defect signals accumulate as work progresses downstream. These concentrations indicate locations where feedback quality, visibility, or handover mechanisms introduce friction into the defect-handling flow.
By breaking down Non-Defect Ratios per stage, organizations can identify where ticket waste enters the system and focus further analysis on those locations.
The stage-specific diagram illustrates that ticket waste is not evenly distributed. High Non-Defect Ratios typically concentrate at specific stages, interfaces, or handover points – often far from where defects are fixed.
This view increases observability, but also measurement cost. It should therefore be introduced selectively, guided by patterns observed at coarser levels.
Interpreting Non-Defect Ratio in Larger Value Streams
In smaller, well-bounded value streams, a high Non-Defect Ratio typically indicates local issues in defect reporting, diagnostics, or intake discipline. Improvements in tooling, feedback quality, and test alignment often lead to relatively fast and visible reductions.
As system size and complexity increase, the Non-Defect Ratio tends to grow non-linearly7. This is not primarily a quality problem, but a consequence of scale. Larger value streams involve more components, more teams, more integration points, and more feedback loops. Each additional dependency increases the likelihood that the same underlying issue is observed, interpreted, and reported independently.
At the same time, feedback cycles become longer and noisier. Defects are discovered further away from their point of origin, often in downstream or system-level stages where context is limited and root causes are harder to determine. As a result, the probability that a reported issue turns out to be a duplicate, a misclassification, or a non-defect increases.
In large value streams, the primary value of the Non-Defect Ratio therefore lies not just in its absolute level, but in its ability to localize where ticket waste is created. Understanding which stages, interfaces, or feedback loops contribute most to non-defect tickets – and for what systemic reasons – is essential.
A measurement system with stage-specific data makes these patterns visible and allows organizations to assess whether changes to feedback mechanisms, information flow, or coordination effectively reduce noise and restore signal quality.
Used in this way, the Non-Defect Ratio becomes a navigation aid for system-level improvement, helping organizations focus their efforts where reduced waste most directly improves flow, feedback quality, and overall value delivery.
Where to Start Measuring
In large value streams, attempting to measure everything from the start is neither practical nor useful. Measurement should begin where it enables fast learning with minimal disruption, and expand only as understanding improves.
Start with a system-level baseline.
An aggregated view of defect ticket outcomes across the entire value stream establishes whether ticket waste is a relevant issue and how it evolves over time. This baseline provides context and helps avoid premature conclusions based on local observations.
This initial view provides context and prevents premature conclusions based on local observations.
Next, focus on the dominant source of ticket waste.
Once waste is visible at the system level, measurement should concentrate on the largest contributing category. In many environments, this is duplicate defects, but the starting point should always reflect the actual distribution observed in the system.
Only then introduce stage-specific measurement.
After a stable system-level view exists, breaking down non-defect tickets by discovery stage, test level, or sub-stream allows waste to be localized.
At this point, the question shifts from:
“How much waste do we have?”
to: “Where does it originate and why?”
Breaking down non-defect tickets by discovery stage, test level, or sub-stream helps identify hotspots where misaligned test strategy, delayed fix propagation, or noisy feedback dominate.
Conclusion
Non-defect tickets are not an anomaly – they are an inherent byproduct of how feedback, information, and coordination are designed in a value stream. Left unmanaged, they consume capacity, distort feedback, and slow down learning without improving the product.
Viewed through a Value Stream lens, duplicate defects and other forms of ticket waste represent a flow problem. The Non-Defect Ratio makes this waste visible and – when applied with appropriate resolution – helps localize where systemic friction enters the defect-handling flow.
Used as a diagnostic signal, the Non-Defect Ratio supports informed decisions about feedback mechanisms, test strategy alignment, and fix propagation across stages. In this role, it becomes a practical navigation aid for reducing waste, improving feedback quality, and strengthening end-to-end flow.
Notes & References
- Emerging tooling increasingly supports defect reporters during submission by automatically collecting diagnostics, suggesting missing contextual information, and detecting similarity to already known issues. AI-assisted intake mechanisms can significantly improve signal quality early, without discouraging reporting, by guiding reporters toward clearer descriptions and existing defect knowledge. ↩︎
- In some environments, issues discovered in later stages receive disproportionate attention due to customer impact or management visibility. In such situations, teams may hesitate to classify reports as duplicates—even when technically correct—leading to distorted defect metrics. This is a governance and incentive problem, not a data quality issue, and further amplifies noise in downstream feedback. ↩︎
- Insufficient visibility of known issues is often reinforced by local incentives. Testers in downstream stages or separate departments may be rewarded for the number of tickets submitted rather than for confirmed defects. Combined with ignored or hard-to-consume release notes—due to limited availability, poor readability, or a high volume of known issues—this leads to duplicate submissions despite existing knowledge. ↩︎
- Under these conditions, silo thinking and local optimization are common and often rational responses. When ownership, incentives, and feedback are stage- or team-local, individuals tend to optimize for their immediate context rather than for end-to-end flow. This behavior is not a mindset failure, but a predictable outcome of how the system is structured. ↩︎
- If your system has other dominant non-defect types, start there. ↩︎
- When establishing measurement, data quality should be reviewed and made transparent to its users. Experience shows that this effort often reveals additional process and tracking issues, improves the measurement system itself, and builds trust in the resulting insights. ↩︎
- In very large and highly distributed systems, duplicate reporting is often amplified by version skew and delayed propagation of fixes. In one real-world case, the same defect was reported more than 50 times across different stages because downstream test environments were working with older versions in which the defect was already known and fixed upstream. The fix and its context did not reach all stages in time, and testers—lacking reliable visibility into current defect status or release information—reported the issue independently. This illustrates how delayed flow and fragmented visibility, rather than missing understanding, can drive extreme duplicate counts. ↩︎
Author: Peter Vollmer – Last Updated on January 20, 2026 by Peter Vollmer