Defect Backlog & Flow Rate
Definition and Purpose
Defect Flow Rate describes the rate at which defects enter and leave the system over a defined time period (e.g. day, week, month). It compares incoming defects (detected or reported) with resolved defects (fixed and verified).
Defect Backlog represents the current amount of unresolved defect work in the system. It reflects how many defects are waiting for analysis, fixing, integration, or verification at a given point in time.
Together, Defect Backlog and Flow Rate provide a system-level indicator of stability and load, showing whether the value stream can absorb change or is accumulating quality-related work faster than it can resolve it.
Defect Backlog and Flow Rate as Flow Metrics
From a flow and systems perspective, the defect backlog is a form of work in progress (WIP). It represents unfinished quality work that competes with new feature development for system capacity.
A growing defect backlog indicates a systemic imbalance, where change is introduced faster than quality can be assured. Typical consequences include:
- Features are developed faster than defects can be resolved, causing quality work to accumulate
- Increased coordination effort, as more defects compete for attention, planning, and prioritization
- Higher risk of follow-up issues and regressions, due to longer defect aging and reduced context
- Longer and more disruptive hardening phases, as unresolved defects are pushed into late stabilization cycles (see DevOps Evolution Model)
Visualizing Defect Backlog and Flow Rate
Defect Backlog and Flow Rate are often presented in the same diagram, as the inflow and outflow of defects directly determine the size and trend of the backlog over time.
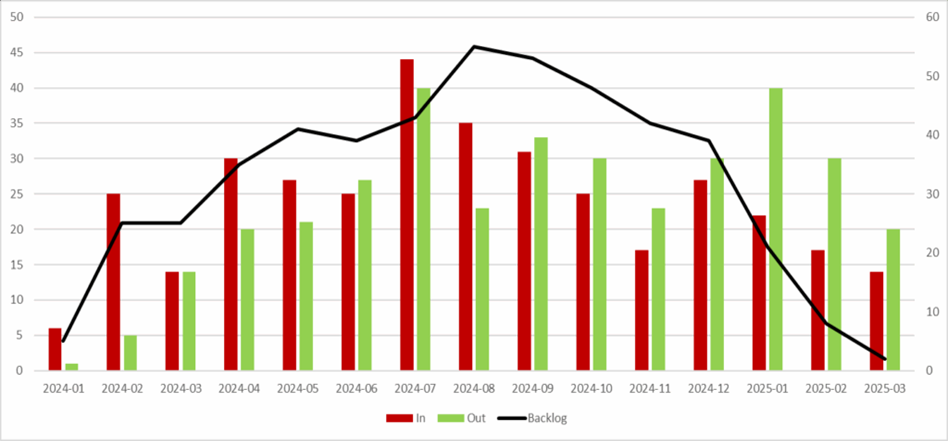
The bars show defect inflow (red) and outflow (green) per period, representing how many defects enter the system and how many are resolved during each time interval. The line represents the cumulative defect backlog, showing how unresolved defects accumulate or are reduced over time.
More granular views – such as breakdowns by severity, status, component, or ticket category – serve an analytical purpose, helping to identify bottlenecks, quality risks, or hidden queues.
Professional measurement and reporting systems make it easy to apply filters and present Defect Backlog and Flow Rate in multiple ways – for example by defect severity, status, component, or ticket category. This flexibility is valuable, but it requires clarity about the intent of a given view.
Depending on context, filtered views – such as focusing on critical or high-impact defects – may be used as health indicators to assess overall stability and risk. Other breakdowns support deeper analysis, for example to identify bottlenecks, quality issues, delayed feedback, or hidden queues. All of these views can coexist, but each should be used with a clear rationale. Without an explicit distinction between health monitoring and analysis, filtered views risk obscuring systemic signals rather than clarifying them.
When interpreting this diagram, both the backlog trend and the absolute backlog level matter, but they answer different questions. (1) The trend of the backlog shows whether the system is stabilizing, overloaded, or recovering over time. (2) The absolute backlog size provides important context: consistently high backlog levels often indicate insufficient defect prevention, especially when combined with high Defect Escape Rates in earlier stages or long Defect Resolution Times.
A rising backlog signals that defects enter the system faster than they are resolved. A stable backlog suggests balanced detection and resolution, while a declining backlog indicates recovery or increased resolution capacity. However, a stable backlog at a high level may still reflect systemic quality issues that require upstream improvement.
Typical Backlog Patterns in Development Systems
A common pattern in many development systems is an initial growth of the defect backlog, reaching a peak around the point where feature development is considered complete. This peak often coincides with a transition into a stabilization or hardening phase, during which most effort shifts toward defect fixing. As a result, the backlog begins to decrease as defects are resolved – often focusing first on the most critical issues when time is limited.
This pattern reflects a delivery approach rooted in sequential or phase-oriented thinking, where functionality is prioritized early and quality is addressed later. In contrast, in an iterative or continuous delivery system, the defect backlog curve should remain flat or at least significantly flatter, indicating that defect resolution keeps pace with defect introduction throughout development.
The assumption underlying the peak-and-decline pattern is that completing features is more important – or more strongly incentivized – than maintaining quality. This assumption is questionable. High defect backlogs increase work in progress, amplify coordination effort, and reduce overall system productivity. Unresolved defects slow down development1, complicate integration, and consume capacity that could otherwise be used for delivering value. From a flow perspective, delaying quality work does not accelerate delivery – it undermines it.
A high Deployment Frequency, when combined with short Defect Resolution Times, helps keep defect backlogs small by enabling fast fixing, validation, and feedback. Conversely, low Deployment Frequency is often a root cause of long Defect Resolution Times, as fixes wait for integration, validation, and release opportunities.
When defects cannot be resolved and validated quickly, work in progress increases and defects accumulate faster than the system can absorb them, leading to growing defect backlogs and reduced system productivity.
Interpreting Defect Backlog and Flow Rate Across the Value Stream
In large and complex value streams, the system-level Defect Backlog and Flow Rate act as a health indicator. They show whether the value stream as a whole can absorb change, resolve defects, and remain stable over time.
At the same time, Defect Backlog and Flow Rate at the level of substreams, components, or integration points provide diagnostic insight. Differences in backlog growth, resolution rates, or flow patterns help identify bottlenecks, quality issues, delayed feedback, and hidden queues within the value stream. Local backlogs are therefore not just performance metrics in themselves, but signals that point to structural constraints or missing feedback.
Used together, the system-level view and the stage-level breakdown make it possible to distinguish between overall system health and localized flow problems, and to focus improvement efforts where they have the greatest impact.
Where to Start Measuring Defect Backlog & Flow Rate
Defect Backlog and Flow Rate are most useful when measured at the system or major integration level, rather than at the level of individual teams or components. At this level, the metrics reflect the true balance between defect introduction and resolution and make systemic overload or recovery visible.
A good starting point is the stage where defects are first integrated and validated end-to-end, such as system testing, release qualification, or production. This is where late detection, long resolution times, and coordination overhead tend to accumulate and where backlog growth has the greatest impact on overall flow.
When interpreting Defect Flow Rate, it is important to consider it in relation to the amount of change introduced into the system. Periods with increased feature development, large refactorings, architectural changes, or onboarding of new components naturally lead to higher defect inflow. Similarly, targeted test campaigns, stabilization initiatives, or quality drives can temporarily increase detected defects without indicating a deterioration in system quality. Flow Rate should therefore always be read in context, not in isolation.
As with all flow metrics, focus on trends over time, not individual data points. Short-term fluctuations are expected; sustained imbalances between defect inflow and outflow indicate structural issues. Defect Backlog should always be interpreted together with Defect Flow Rate – absolute backlog numbers without inflow and outflow context are misleading.
Once a stable system-level view is established, measurement can be extended upstream to earlier stages to understand where defects are introduced, where they accumulate, and which stages limit resolution capacity. Starting too granular too early often hides systemic imbalances; starting at integration points makes them visible and actionable.
Conclusion
Defect Backlog and Flow Rate make the combined effect of the other flow and quality metrics visible. Deployment Frequency determines how often learning can occur, Defect Escape Rate determines how late learning occurs, and Defect Resolution Time determines how quickly learning is acted upon. Defect Backlog & Flow Rate show whether the system can sustain this balance over time.
Used in combination, these metrics turn defect data from retrospective reporting into input for deliberate system design decisions – revealing where feedback is too slow, recovery is too costly, or change exceeds the system’s ability to absorb it.
Notes & References
- Large defect backlogs also create significant secondary waste. A high number of open defects increases the likelihood of duplicate defect reports, which in many systems can account for a substantial share of all defect tickets. Reviewing, triaging, and closing these duplicates consumes effort without creating additional value.
Existing defects can also hinder effective testing. New issues may be hidden behind known problems, or testers may need to apply workarounds to continue testing, reducing feedback quality and increasing effort.
These effects are strongly influenced by organizational separation between development and testing. When teams are siloed, the additional work, complexity, and friction caused by growing defect backlogs are primarily experienced on the testing side. Development teams often do not see these consequences directly and therefore lack a natural feedback signal that would trigger earlier corrective action.
In cross-functional or stream-aligned teams, these effects are more visible. Because development and testing are closely integrated, the cost of growing defect backlogs is felt by the same people who introduce change, making quality degradation harder to ignore and more likely to be addressed early. ↩︎
Author: Peter Vollmer – Last Updated on January 15, 2026 by Peter Vollmer