Using the Assembly Line Approach for Value Stream Optimization
This article presents the Assembly Line Model as a practical tool for the optimization of value streams. It explores how to systematically enhance the model to measure performance, identify bottlenecks, and establish a structured measurement system that supports continuous, data-driven improvement.
„Systematic improvement is not a goal – it’s a habit built on metrics, feedback, and intent.1„
Systematic Value Stream Optimization
Systematic Value Stream Optimization represents the third and final stage in the Value Stream Lifecycle. It builds on the foundations established in the first two stages and completes the logical flow of Value Stream Thinking, which follows a clear sequence: understanding, organizing, and improving the flow of value.

In Stage 1 – Identification, we focus on understanding the value stream: What is my value stream, and why does it exist? Using the Value Stream Canvas, we define its purpose, scope, and the value it creates for its customers. We then develop a current state description that makes the value stream visible and comprehensible – modeling its flow, interactions, and dependencies in a way that enables meaningful analysis and improvement.
In Stage 2 – Organizing Around Value, we establish the foundation for systematic improvement by designing the value stream so that work aligns naturally with the flow of value. This stage is about building the preconditions for effective optimization through option building, team design, and ownership structures that support end-to-end flow. The result is a system that is organized for speed, quality, and collaboration – ready to be further improved systematically.
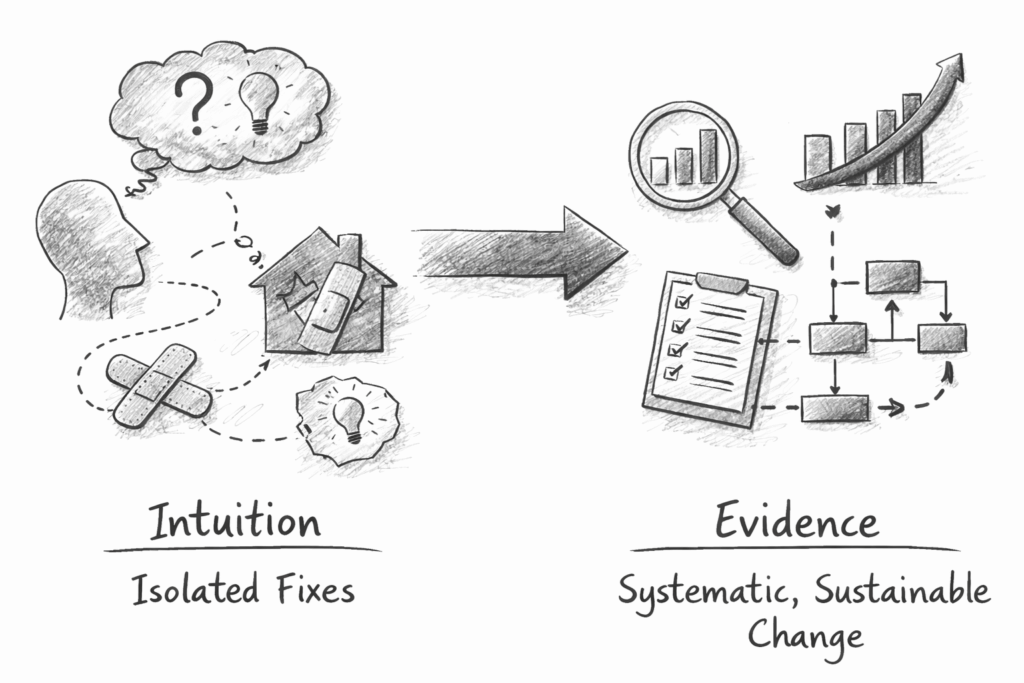
With this foundation in place, Stage 3 – Optimization begins. Here, we establish a measurement system that defines the key parameters of value stream performance and provides the analytical capability to understand the current state. This system not only enables us to objectively determine whether improvements are taking effect but also highlights where further optimization is needed. By defining what to measure, how to measure it, and how to visualize the results, we create the data-driven foundation for continuous learning and improvement – moving from intuition to evidence and from isolated fixes to systematic, sustainable change.
This article explains the mindset and principles behind systematic optimization of development value streams, showing how measurement and feedback guide learning and improvement over time. It helps teams and organizations build the conditions for adaptability, data-driven learning, and sustained high performance – unlocking the full potential of their value streams.
How Systematic Value Stream Optimization Works
This diagram shows value stream optimization as a system2, not a sequence of activities. Each major entity plays a distinct role, and improvement emerges from their interaction.
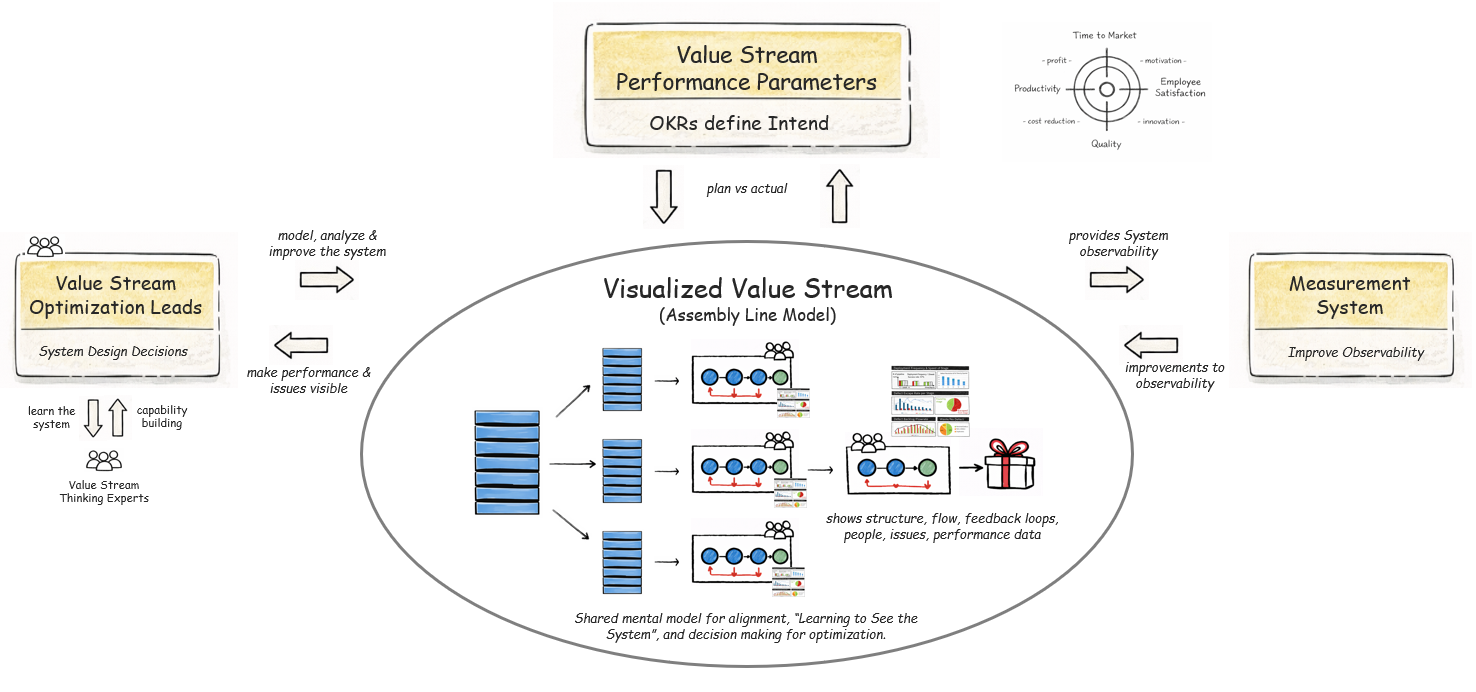
- Value Stream Performance Parameters define intent. Expressed as OKRs, they clarify what “better” means in terms of flow, quality, and outcomes. They set direction, not solutions.
- The Visualized Value Stream (Assembly Line Model) is the shared mental model of the system. It makes structure, flow, feedback loops, people, issues, and performance data visible. Its primary purpose is learning: helping everyone “see the system” well enough to reason about change.
- The Measurement System provides observability. It attaches flow, learning and quality signals to the visualized value stream, enabling objective comparison of plan vs. actual and revealing trends, constraints, and unintended effects.
Examples of such signals include Deployment Frequency (DF), Defect Escape Rate (DER) and Defect Resolution Time (DRT). Deployment Frequency makes visible how often the value stream creates meaningful feedback by showing the cadence at which successful hand-offs occur across stages. Defect Escape Rate reveals where the value stream fails to learn early enough by showing which defects escape their intended feedback stages. Defect Resolution Time complements this view by indicating how long the system remains unstable once a defect has escaped and been discovered.
Together, these metrics provide a coherent system level view of learning speed, learning quality, and recovery capability. They connect early learning, late recovery, and system economics, and turn measurement into input for deliberate system design decisions rather than retrospective reporting. - Value Stream Optimization Leads3, supported by Value Stream Thinking Experts4, use the model and measurements to make system design decisions – policies, flow changes, automation, and responsibility boundaries. These are deliberate interventions in the system, not local fixes.
Feedback Cycles as the Engine of Value Stream Performance
Several factors influence the speed, productivity, and quality of a value stream. In an iterative and incremental development environment, the entire process operates as a series of feedback and learning cycles. The shorter and more reliable these cycles are, the faster the system can learn, adapt, and deliver value.
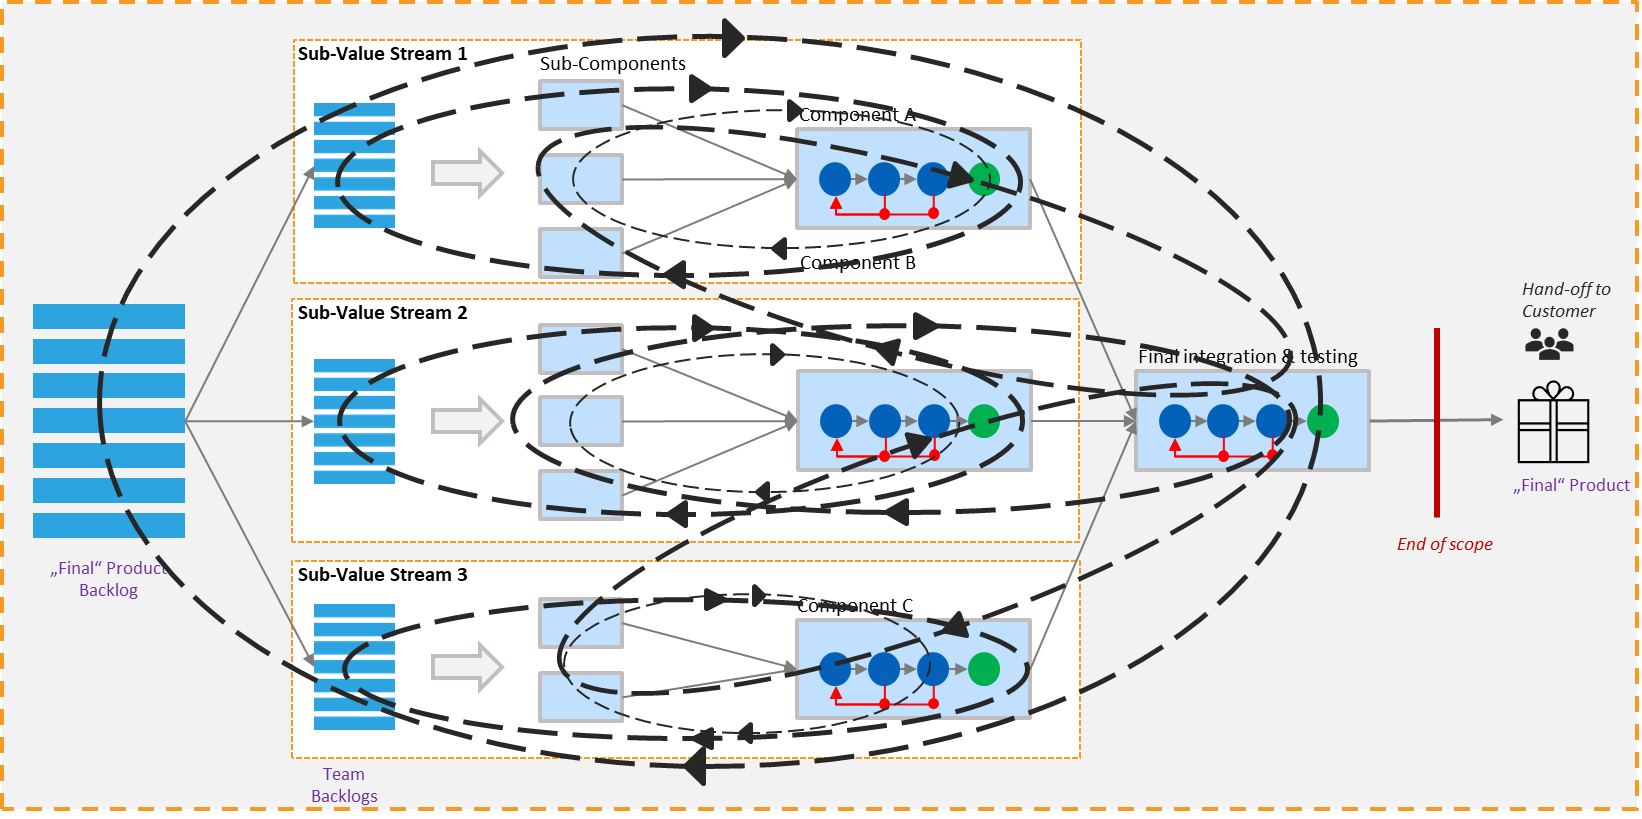
These feedback cycles exist not only across the overall value stream, but also within and between its sub-value streams. Work flows from left to right through multiple stages and integration levels. Feedback flows back from each stage to where learning and corrective action can occur. As illustrated in the diagram below, these cycles differ significantly in speed, scope, and cost – ranging from fast, localized loops within teams to longer, system-spanning cycles that involve multiple components and coordination points.
Bottlenecks, queues, waiting times, waste, and other inhibitors of flow can arise anywhere in this network of cycles. Improving the system therefore requires a model that is suitable for the purpose at hand: a visualization that is understandable, deliberately abstracts reality, and selects the attributes that make constraints, delays, and quality issues visible – while omitting irrelevant detail.
When a suitable model guides what we see, the right KPIs make system behavior measurable, and people are trained in engineering, Lean-Agile, and DevOps principles and practices, value stream optimization becomes effective, sustainable, and repeatable.
With this understanding of how feedback and learning cycles shape value stream performance, we can now examine the key levers that allow us to improve them. Each lever targets a different aspect of flow, learning, and system behavior – and together they form a comprehensive approach to systematic value stream optimization.
- Shift Left – Shorten Feedback Cycles: Move activities earlier in the development process to detect and fix issues sooner, preventing long finalization or stabilization phases.
- Increase Cycle Speed & Frequency: Run more learning & delivery cycles within the same timeframe and get faster feedback within a cycle.
- Reduce Cycle Time – Move work faster from left to right – and feedback faster from right to left – to shorten overall lead time.
- Improve Cycle Reliability: Reduce failures and rework to maintain a consistent, predictable flow.
- Eliminate Waste: Remove non–value-adding activities that slow down or complicate the system.
1. Shift Left – Shorten Feedback Cycles
In the context of Value Stream Optimization, Shift Left means far more than testing earlier. It is about moving learning, validation, and quality activities upstream so that issues are detected and resolved when the cost of change is lowest.
Earlier feedback reduces batch sizes, shortens learning loops, and prevents long stabilization or hardening phases at the end of development. An equally important aspect of Shift Left is avoiding the accumulation of undone work – activities required for release that are postponed beyond a team’s Definition of Done. When work is deferred, batch sizes grow, integration becomes harder, and defects escape into more expensive parts of the value stream. Shift left reduces variability, accelerates flow, and improves predictability.
Shift Left is therefore not a rule, but a conscious system design decision – guided by economics, technical feasibility, and the question of where learning creates the highest leverage. The goal is not to push work upstream by default, but to deliberately decide which validation and quality activities should happen earlier because the cost of delay outweighs the cost of early execution.
Effective Shift Left requires the right conditions: adequate team capacity, sufficient automation, stable integration and test environments, and shared engineering practices and quality standards. When these foundations are missing, pushing more work upstream does not fail because Shift Left is wrong – it fails because the system is not yet designed to support it. Building these capabilities is therefore not optional overhead, but a prerequisite for making early learning productive, sustainable, and economically sound.
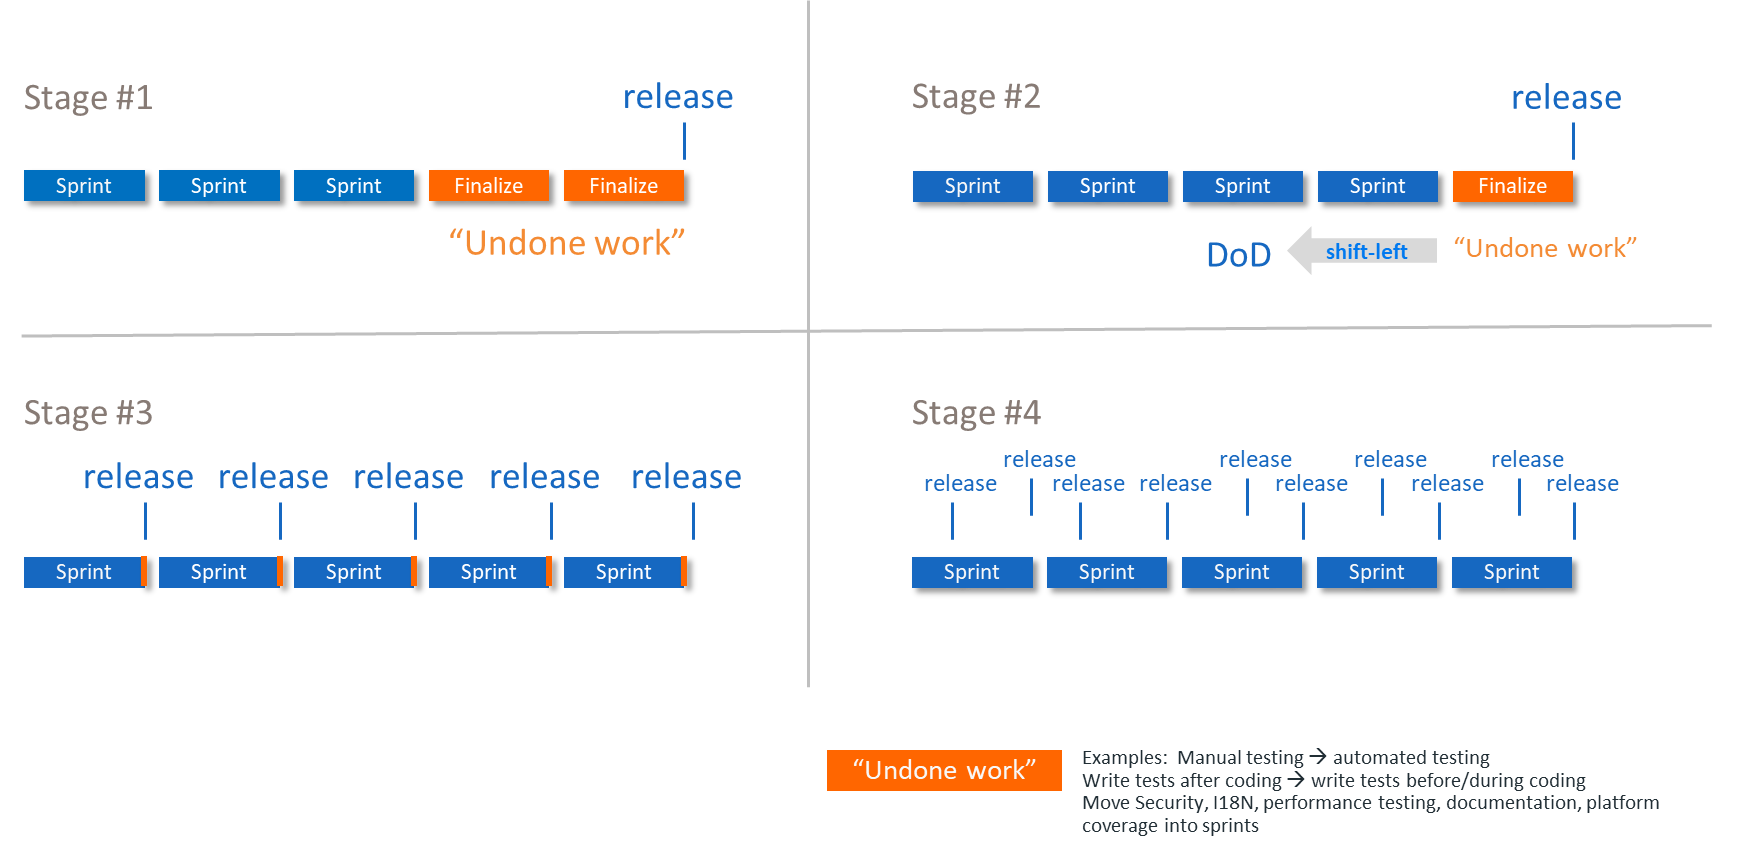
The DevOps Evolution Model
The DevOps Evolution Model provides a practical lens for understanding how undone work moves into the Definition of Done (DoD) as organizations mature. Each step reduces batch size, shortens feedback cycles, and lowers the cost of change – creating the foundations for faster learning and more predictable flow.
Rather than serving as a checklist, the model acts as a decision-support tool. It helps teams evaluate their current engineering and operational practices, identify where undone work still exists, and explore which learning and validation activities can realistically be moved upstream. This assessment creates a shared understanding of the current state and aligns the organization on the next feasible target state for improvement.
Importantly, the optimal level of DevOps maturity is not universal or purely technical – it is a business decision. The right target stage depends on market needs, desired delivery speed, acceptable risk, and the organization’s ability to support earlier validation. Technical feasibility also plays a critical role, especially in cyber-physical systems, where hardware constraints, specialized test setups, and long integration cycles limit how far teams can shift learning and testing upstream.
The DevOps Evolution Model therefore provides direction, not prescription. It supports realistic discussions about which improvements will have the highest impact on flow, where automation and tooling are required, and how to sequence investments that reduce batch size, shorten feedback cycles, and enable a smoother path toward continuous integration and delivery.
For a detailed explanation of all four stages and their implications, see the dedicated article The DevOps Evolution Model.
Building on this perspective, the DevOps Evolution Model serves not only as a maturity model but also as a practical decision-support tool. It helps organizations evaluate how much undone work remains outside the normal workflow, understand the limitations of their current engineering and operational practices, and identify which improvement steps will yield the highest impact on flow and feedback cycles.
As teams progress through the stages of the model:
- batch sizes decrease
- validation is pulled earlier
- the cost of change drops significantly
- integration frequency increases
- fewer defects escape into expensive downstream stages
Together, these improvements enable faster, safer, and more predictable delivery.
Feedback Cycle Times per Stage and Defect Types
Feedback in a development value stream is not uniform. Different stages generate feedback at very different speeds, with very different costs, and with very different diagnostic power. Each stage is therefore suited to detecting specific kinds of issues, while being inherently blind to others.
As a general pattern, early stages provide fast, focused feedback with low cost of change, but limited system context. Later stages provide broader and more realistic validation, but at the expense of longer learning cycles, higher coordination effort, and greater impact when changes are required. The further a defect is discovered to the right, the more time has passed, the more context has faded, and the larger the blast radius of a fix becomes.
Understanding this relationship between feedback timing and defect types is essential for making informed shift-left decisions. The goal is not to eliminate late feedback – which remains necessary for certain classes of defects – but to ensure that repeatable learning happens as early as possible, while unavoidable late learning is treated as a signal for improvement rather than a normal operating mode.
The diagram below illustrates these feedback cycles and defect types across the development value stream. A detailed explanation of each stage, including typical feedback cycle times and defect characteristics, is provided in the dedicated article Feedback Cycle Times and Defect Types.

2. Increase Cycle Frequency
Beyond shifting learning earlier in the value stream, another powerful lever for accelerating delivery is increasing the frequency of learning cycles themselves. The more often a value stream completes a build–integrate–test–feedback–adjust cycle, the faster it can learn, adapt, and deliver improvements. Increasing cycle frequency multiplies the speed of discovery, enabling organizations to detect issues earlier, refine solutions faster, and move toward higher flow and reliability.
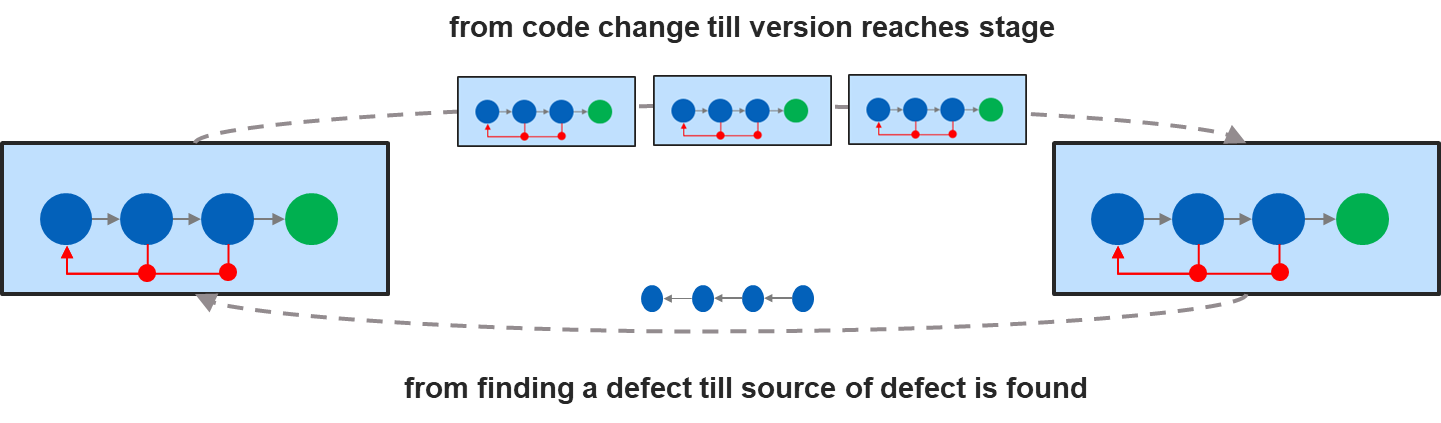
Cycle frequency can be increased in two complementary ways: by accelerating the movement of work from left to right, and by speeding up the flow of feedback from right to left.
From left to right refers to the flow of work – from making a code change until that change reaches a defined stage in the assembly line.
From right to left refers to the flow of feedback – information moving back from a given stage to where it can be analyzed and translated into a new code change. This feedback can stem from a detected defect, an improvement idea, or any insight that helps enhance the product.
Optimize from left to right
Optimizing from left to right means improving the flow of work to make delivery faster without compromising product quality or process reliability. Typical measures include reducing hand-offs, waiting times, and queues, as well as automating repetitive activities such as documentation generation, release note creation, test environment setup, test case generation, test execution, and result evaluation.
Additional enablers can include improving build and integration speed, streamlining approval and deployment processes, and increasing the frequency and reliability of integrations and releases.
Optimize from right to left
Optimizing from right to left is mainly about the ability to route feedback quickly to the right source and to make fast, informed decisions about learning and corrective action.
A simple and representative example is the defect feedback process.
The more complex the environment and the more people are involved, the longer the lead times tend to be. The picture below shows a real-world example.
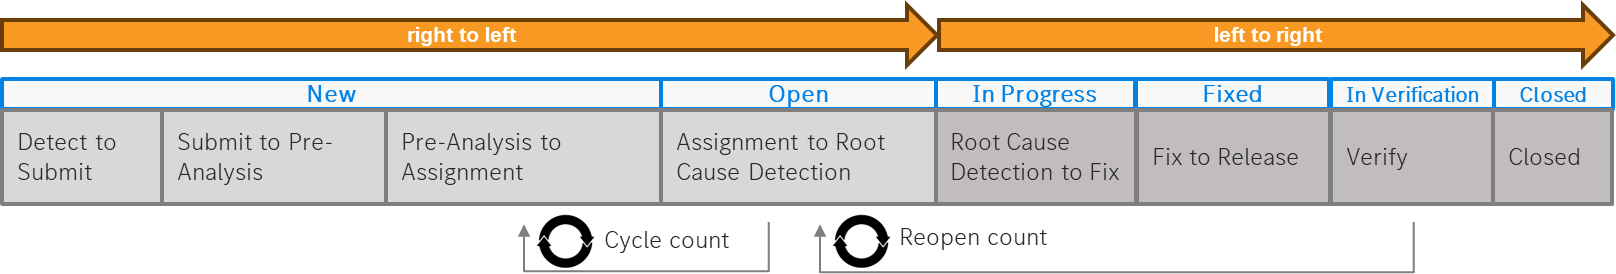
Typical stages in the defect feedback cycle (right to left):
- Detect to Submit
Time between detecting a potential defect and submitting it into the defect tracking system.
(In physical testing — e.g., vehicle test campaigns — delays are common due to the time required to collect and report issues.) - Submit to Pre-Analysis
Time required to upload and process the collected data (often megabytes or gigabytes of telemetry) to make it analyzable. - Pre-Analysis to Assignment
Time from first technical analysis until the issue is assigned to the responsible experts or developers. - Assignment to Root Cause Detection
Time needed by the responsible experts to understand and identify the underlying cause of the defect.
From right to left there are additional stages such as:
- Root-Cause Detection to Fix
Time required to implement the corrective change after the root cause has been identified. - Fix to Release
Time from completing the fix to preparing and releasing a new build that includes the correction, and propagating it through the necessary stages up to the stage where the defect was originally detected. - Verify
Time needed to validate the fix in the relevant test environment or integration stage to ensure that the issue is resolved and that no regressions were introduced. - Closed
The final phase in which the defect is confirmed as resolved, verified across the required stages, and formally closed in the tracking system.
If the necessary data is available, each phase can be measured and analyzed, revealing opportunities to accelerate flow and improve speed.
Improve Cycle Reliability
A feedback cycle only completes when it succeeds. Failures – such as broken builds, integration issues, or failed deployments – interrupt learning, increase rework, and reduce effective cycle frequency, often creating downstream queues.6
Reliable pipelines enable consistent flow, small batch sizes, and fast learning. Deployment frequency serves as a practical indicator: how often a downstream stage can successfully consume a new system version.
3. Eliminate Waste
Any unnecessary activity adds effort, slows down the system, and reduces the capacity for learning. Such forms of waste should therefore be identified and eliminated wherever possible. In product development, typical sources of waste include unclear or frequently changing requirements, overly complex processes or governance steps, and inefficient knowledge flow that forces teams to search for information or rely on tribal knowledge. Additional waste arises from context switching, overengineering, manual detective work such as log inspection, fragmented tooling, slow or unclear decision-making, ineffective test design, and unbalanced cognitive load across teams. Eliminating these sources of waste strengthens flow, improves predictability, and increases the organization’s ability to learn quickly – the core drivers of fast and reliable value delivery.
Conclusions
Systematic value stream optimization is not achieved through isolated improvements or intuition alone. It requires making the flow of work visible, measuring what truly influences speed and quality, and using feedback to guide deliberate system design decisions. The Assembly Line Model provides a practical structure for doing exactly that—linking visualization, metrics, and learning into a coherent optimization approach.
By focusing on feedback cycles, flow, and quality metrics, organizations can move from reactive problem-solving to intentional, data-driven improvement. Optimization then becomes a continuous discipline: grounded in evidence, informed by context, and sustained by a shared understanding of how value actually flows through the system.
Notes & References
- This quote was created during a conversation between me (Peter Vollmer) and ChatGPT. I was seeking a statement that reflects the mindset of systematic improvement – grounded in measurement, feedback loops, and purposeful action – based on my past experience with successful optimizations on the Assembly Line. ↩︎
- This is a system because no single element creates improvement on its own. Performance parameters guide attention, visualization enables understanding, measurement provides evidence, and people make design decisions. Changes to any part affect the others through feedback loops. Optimization therefore happens through continuous learning and adaptation, not by executing a predefined improvement plan. ↩︎
- Value Stream Optimization Leads are people working within the value stream who take explicit responsibility for guiding its optimization. The role exists regardless of title and may be fulfilled under different names across organizations. It requires a working understanding of Value Stream Thinking, system design and architecture, Lean-Agile principles and practices, and DevOps concepts, in order to reason about flow, feedback, and deliberate system improvements. ↩︎
- Practical knowledge emerges through experience and continuous learning in the value stream. It is grounded in the insights of the people doing the work and complemented by internal or external Value Stream Thinking experts who bring experience from many organizations and value streams. Developing and applying this knowledge requires intentional learning and improvement moments – such as retrospectives or Inspect & Adapt events – as well as clearly assigned roles that actively drive optimization, for example value stream optimizers or architects. ↩︎
- Numerous additional feedback cycles exist in the value stream; however, depicting them all would make the illustration harder to read. ↩︎
- In practice, unreliable cycles create downstream queues. Integration and system-level stages often depend on the timely delivery of specific components, such as critical bug fixes or essential functionality. When these deliveries are delayed or fail, downstream work is blocked, leading to waiting and idle capacity.
To stay “productive,” teams often start new work while waiting, which increases work in progress (WIP). Higher WIP in turn amplifies context switching, coordination effort, and variability, further slowing feedback and degrading overall flow. In large systems, this dynamic can cascade quickly, allowing a single unreliable component to negatively impact the performance of the entire value stream. ↩︎
Author: Peter Vollmer – Last Updated on Januar 15, 2026 by Peter Vollmer