What is in the Blue Boxes of the Assembly Line?
Introduction
The Assembly Line is a model of how work moves through a product development system. It can span the full development journey – starting as early as exploration or requirements gathering, moving through implementation and integration, and extending all the way to deployment and release. Not every Assembly Line covers this entire range. Where the boundaries are drawn is a modeling decision, shaped by what is most relevant to make visible for a given team, product, or organization.
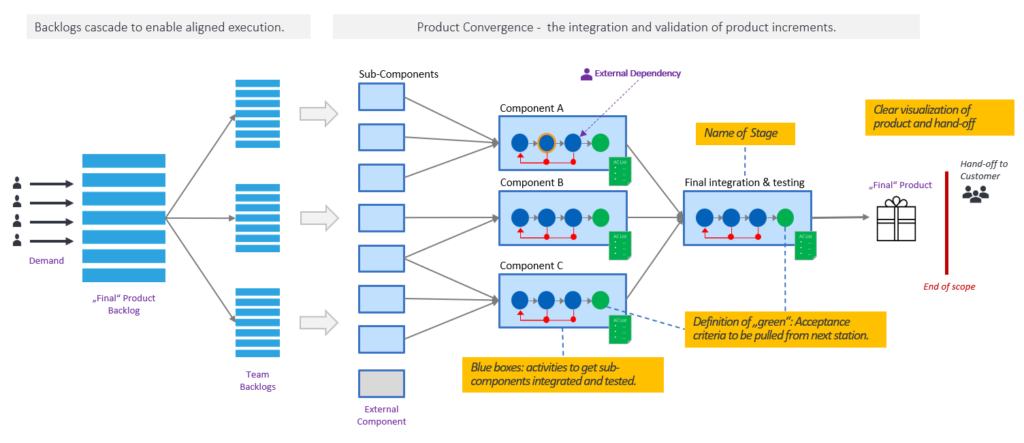
At the heart of every Assembly Line lies implementation – the transformation of requirements into working systems. Individual components are built and tested, then assembled into subsystems, which are then progressively integrated into larger products or solutions.
This reflects the natural logic of building systems: the same cycle of build, test, and integrate repeats at every level, from the smallest module to the full system. The pattern applies equally to pure software systems and to cyber-physical systems, where hardware and software are developed and integrated together.
This article explains what lives inside the blue boxes, also called stages of that model – the activities, the sequencing, and the quality gates that determine whether work can move forward. It also covers how modeling decisions shape what becomes visible, how feedback cycles and external dependencies are represented, what the Software Under Test means at each stage, and how the Assembly Line serves as a tool for both understanding the current state and designing a better one.
Boxes and Circles
The Assembly Line is represented as a sequence of boxes connected by arrows. Each box describes a stage in the development or integration process, and the arrows show the direction of flow – work moves from left to right, from earlier stages to later ones.
A model always serves a purpose, and the level of detail should match that purpose. When starting to model a value stream, the focus is usually on the big picture – understanding how stages relate to each other, where work flows, and what the overall structure looks like. At this stage, the activities inside the boxes are often not yet relevant, and leaving them empty keeps the model readable and focused on what matters most.
As the understanding of the value stream deepens, or when a specific problem needs to be investigated, more detail can be added where it is needed. A stage that is taking too long, producing too many defects, or creating bottlenecks may benefit from having its internal activities made visible. Modeling the activities inside a box can help identify root causes, reveal hidden dependencies, or simply make an issue visible to the people who need to act on it.
When modeling the inside of a box, the circles and arrows follow a consistent visual language. Blue circles represent activities – the work performed within that stage. Arrows between circles show the sequence and dependencies between those activities. Where activities can run in parallel, multiple rows of circles can be used, with arrows showing where they split and where they converge again. Further visual conventions – an orange border for human approvals and a dotted purple arrow for external dependencies – are introduced in the sections below as they arise in context.
Once the activities and their dependencies have been modeled, drawing the quality gate explicitly is a useful final step. The green circle on the right of the box represents the acceptance criteria that must be fulfilled before the output of the stage can move forward. Making it explicit prompts teams to think carefully about what those criteria actually are, which frequently reveals activities, dependencies, or involved people that were previously invisible or simply assumed.
Defining the acceptance criteria for a quality gate is itself a design decision that involves a deliberate trade-off between strictness and flow. Criteria that are too strict delay feedback: work cannot move forward until every condition is met, which can block further development and reduce the frequency of integration. Criteria that are too loose allow problems to pass downstream, where they cause friction, rework, and stabilisation effort that is far more expensive to resolve. A security vulnerability is a good example of this trade-off in practice: security issues are important to fix before release, but they should not necessarily block all further development while a fix is being prepared – unless the issue is severe enough to require architectural changes that affect other work. The right level of strictness depends on the nature of the criteria, the cost of downstream rework if they are not met, and the impact on flow if they are enforced immediately. This trade-off applies not just to acceptance criteria but to the activities within a box as well – adding more activities increases thoroughness but also increases cycle time and delays feedback to the next stage.
A Stage in Practice
Assembly Line drawings range from conceptual representations to detailed models of real stages. In conceptual drawings, a box is often represented with just two or three generic circles – enough to convey the structure without drawing attention to the internal detail.
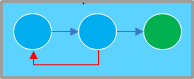
In practice, when modeling a real stage, the activities are named and there are typically more of them. The two examples below show what a development stage and an integration stage might look like when modeled with some care.

The development stage shows a realistic sequence: code and unit test, pull request, merge and build, smoke test, and full test, followed by the quality gate. The smoke test acts as an early filter – a fast, inexpensive check that catches obvious problems before the more thorough full test is run. The feedback cycles appear at multiple points in the sequence, reflecting the iterative nature of real development work. Each red dot marks a point where issues can be caught and returned for correction without having to restart the entire sequence from the beginning.

The integration stage follows a similar pattern but with different activities: integrate, smoke test, test environment setup, full test, and the quality gate with an attached AC List. Here the smoke test runs first against a minimal or already available environment, before the investment of setting up the full test environment is made. If the smoke test fails, the full environment setup is avoided entirely. The AC List attached to the quality gate makes the acceptance criteria explicit and discussable – and as noted earlier, working through it often reveals activities or dependencies that had previously been assumed but never made visible.
Both examples illustrate the same underlying principle: the activities inside a box reflect the real work of the stage, the sequence reflects deliberate decisions about cost and risk, and the feedback cycles make the iterative nature of that work visible. The model does not prescribe what the activities should be – it provides a visual language for making them explicit.
Stages with Multiple Activities and Parallel Tracks
Not all stages are as straightforward as the examples in the previous section. In many domains – automotive, aerospace, medical devices, or large-scale software systems – a single stage can contain many activities, formal approvals, and multiple types of tests that must all be completed before the quality gate is reached. The Assembly Line model accommodates this naturally: a box can contain as many circles as needed, arranged in rows that reflect the actual sequence and parallelism of the work.
A development stage, for example, typically includes activities such as peer review and pull requests before a change is merged, followed by compilation and packaging, and then a series of verification steps – unit tests, static code analysis, security scanning – that can run in parallel. All of these must complete before the quality gate is passed.
An integration stage might have rows for pulling the latest good versions of components, environment setup and deployment, functional testing, and non-functional requirements testing, where some steps must follow others in a specific sequence.

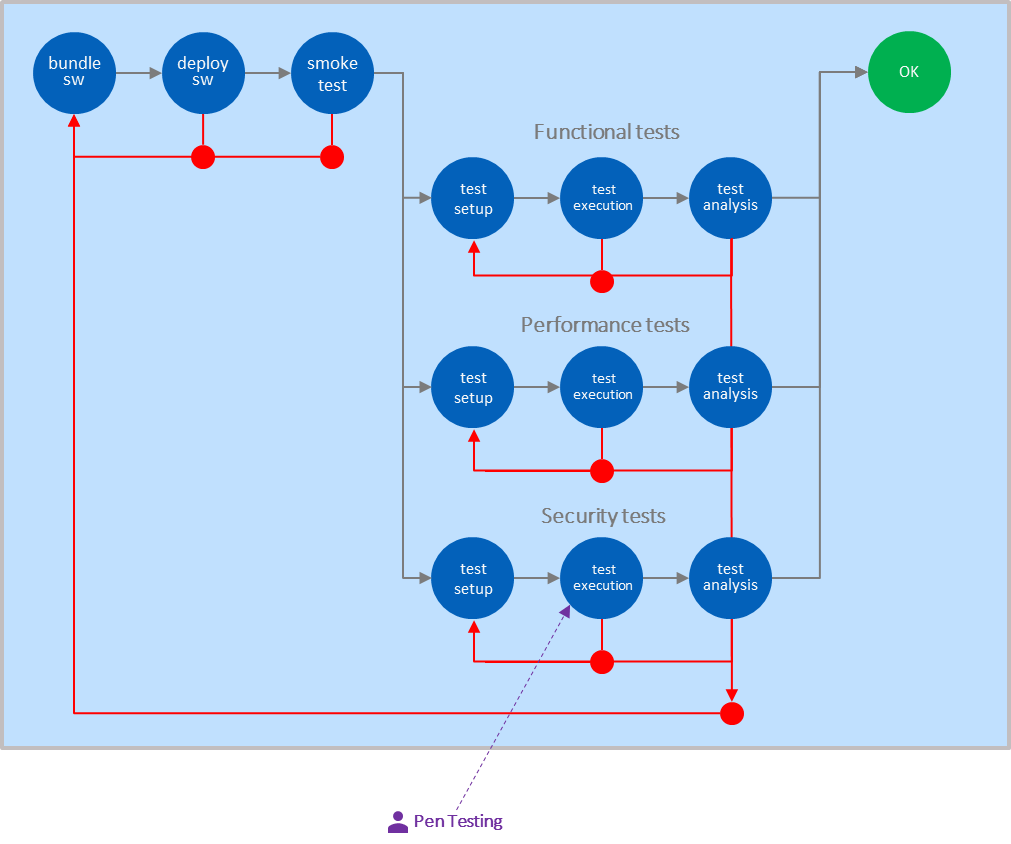
The diagram shows a stage with multiple activities and parallel tracks. The initial sequence follows the main line from left to right: the software is bundled, deployed, and a smoke test is run. The smoke test acts as an early quality check – if it fails, the feedback cycle returns the work to deploy SW for correction before any further testing is attempted. This avoids running expensive or time-consuming tests on a package that has not yet passed the most basic validation.
When the smoke test passes, the flow splits into three parallel tracks: functional tests, performance tests, and security tests. Each track follows its own internal sequence of test setup, test execution, and test analysis, and each has its own feedback cycle allowing issues to be resolved and re-tested independently without affecting the other tracks.
All three tracks must complete successfully before they converge at the quality gate. The green circle represents that quality gate – the single point at which the acceptance criteria for the entire stage are verified and the output is cleared to move to the next stage.
Whether to represent environment setup and deployment as one circle or two is itself a modeling decision. If deployment is fast, reliable and straightforward, a single circle keeps the model clean. If environment setup is slow, error-prone or resource-intensive, splitting it into a separate circle makes that problem visible and measurable – and therefore actionable.
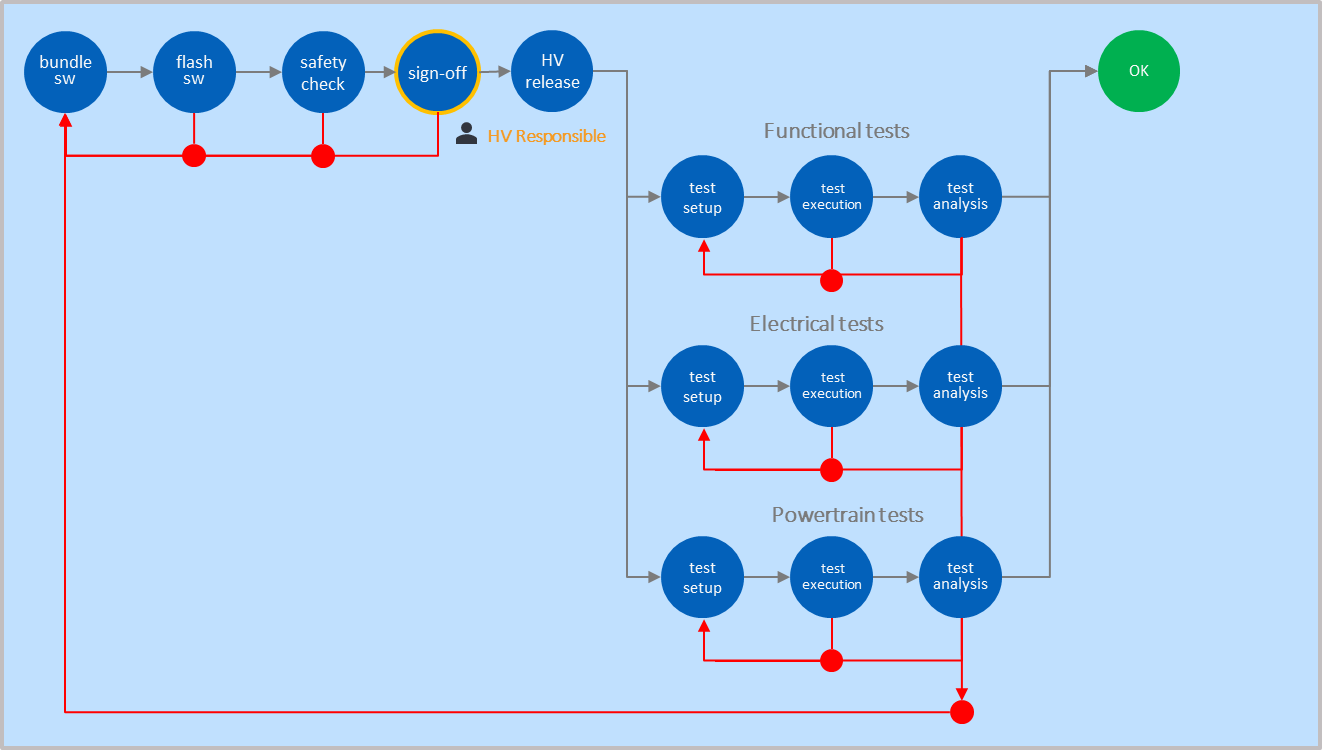
A second example from the automotive domain illustrates how the same structure applies in a safety-critical context. The stage begins with bundling the software and flashing it onto the vehicle. What follows is a high voltage approval sequence consisting of three steps: a safety check, a sign-off, and a formal HV release. Two feedback cycles are shown within the approval sequence – one between flash SW and the safety check, and one between the safety check and the sign-off, reflecting the fact that both steps can fail independently and require correction before the approval sequence can proceed.
The sign-off circle is shown with an orange border. This is a formal part of the Assembly Line visual language: an orange border indicates that a circle requires an active human approval rather than an automated activity. The person or function responsible for that approval can be noted below the circle – in this example „HV Responsible“ identifies the role accountable for the high voltage sign-off. This makes accountability explicit and visible in the model, which is particularly important in safety-critical and regulated domains where approvals carry legal or compliance weight.
This approval is not a bureaucratic formality – it is a safety gate. No further testing is conducted until it is passed, because the consequences of proceeding without it could be dangerous.
Only when the HV release is complete does the flow split into three parallel tracks: functional tests, electrical tests, and powertrain tests. Each track follows its own internal sequence of test setup, test execution, and test analysis, and each has its own feedback cycle. All three tracks must complete successfully before they converge at the quality gate.
This example shows that an approval is not a single circle but can itself be a sequence of activities leading to a formal gate. It also shows that feedback cycles can appear at multiple points within a sequence, reflecting the fact that different steps within an approval process can fail for different reasons and require different corrective actions. The visual language does not change – the circles within the approval sequence are activities like any other, and the sequence between them is made explicit by the arrows connecting them. Sequencing logic in safety-critical domains reflects safety requirements as much as efficiency considerations: flashing the software, verifying safety, and obtaining formal sign-off must happen in that order, and no step can be skipped.
The arrows between circles within a box serve a different purpose than the arrows between boxes. Arrows between boxes show the flow of work through the Assembly Line. Arrows within a box show the sequence and dependencies of activities within a single stage. Both are important, but they operate at different levels of the model.
The quality gate remains the rightmost circle in the box, regardless of how many rows or activities precede it. It is the single point at which the output of the stage is assessed against its acceptance criteria. Only when the quality gate is passed can the output move forward to the next stage in the normal flow.
There are however situations where an early or pre-version of the output is passed to the next stage before the quality gate is reached. This can happen when the downstream stage needs to start early validation, prepare its environment, or give feedback on a preliminary result. In the Assembly Line model, this is made explicit by showing an arrow that exits the box before the quality gate circle. The arrow indicates that what is being passed on is not a fully validated output but a pre-version, shared for early validation purposes only. This is a deliberate modeling choice – making it visible prevents ambiguity about what has and has not been validated at each point in the flow.
Whether to represent a stage as a single box with multiple tracks or as multiple separate boxes is itself a modeling decision. A single box emphasises that all activities belong to one stage and share a single quality gate. Multiple boxes make the internal structure more explicit and allow each stage to be named, measured, and optimised individually. The right choice depends on what the model needs to make visible and the purpose it needs to serve.
This decision also has an organizational dimension. Activities modeled within the same box imply that the people performing them should work closely together – the box is an integration boundary, and collaboration within it is continuous. Activities modeled as separate boxes imply a handoff: a defined output passes from one stage to the next through a quality gate, and the teams on either side may operate more independently. As the Designing Organizations Around Value article describes, dependencies inside a team are experienced as collaboration, while the same dependencies across organizational boundaries become coordination overhead. The Assembly Line model therefore not only describes how work flows – it also reflects, and can inform, decisions about how people and teams should be organized around that work.
External Dependencies
Activities within a stage do not always rely solely on the team or system responsible for that stage. In practice, certain activities depend on input from outside the current scope – an external team, a specialist function, or a third party. The Assembly Line model makes these dependencies explicit using a dotted purple arrow that crosses the box boundary and points to the activity that requires the external input. The person or function providing that input is shown outside the box with a purple person icon and a label identifying their role. In the example below, „Pen Testing“ indicates that the test execution activity in the security tests track is performed by an external penetration testing team rather than the team owning the stage.
This convention is particularly common in current state pictures, where external dependencies often exist as a result of how work has historically been organized rather than by deliberate design. An external dependency of this kind is frequently a flow inhibitor, and it can manifest in several ways: the external team may not be available when the stage needs them, creating waiting time; the cost of involving them in every iteration may be too high, leading to batching that breaks flow; the handoff itself may be expensive in terms of coordination overhead and context transfer; or the external party may operate on a different time cycle with SLAs that are incompatible with the team’s desired throughput. Each of these flavors points to a different root cause and a different improvement path. For this reason, external dependencies shown in a current state Assembly Line are typically a starting point for improvement discussions in future state design – the question being whether the dependency can be internalised, automated, restructured, or renegotiated to restore flow.
The Software Under Test
Every box in the Assembly Line tests something – but not everything. The Software Under Test, or SUT, is the explicit definition of what is included in the test scope at a given stage and what is excluded. The SUT boundary is directly defined by the integration boundary of the box: a component stage tests one component in isolation, an integration stage tests multiple components assembled together, a system stage tests the full system.
This boundary determines what can be learned at each stage and what cannot. A component stage can find errors of commission and errors of omission, but it cannot find interface or integration issues – because no interface is being exercised. Interface issues only become visible when multiple components are assembled. Non-functional behavior only becomes visible under realistic load. Each stage is therefore best suited to detecting a specific class of defects, not because later stages are better, but because the SUT at each stage makes certain defect types visible for the first time. This is the structural foundation of shift-left thinking: understanding what can be detected at each stage, and ensuring that detection happens as early as the SUT boundary allows. The Feedback Cycle Times article covers the relationship between stage, SUT scope, feedback speed, and defect types in depth.
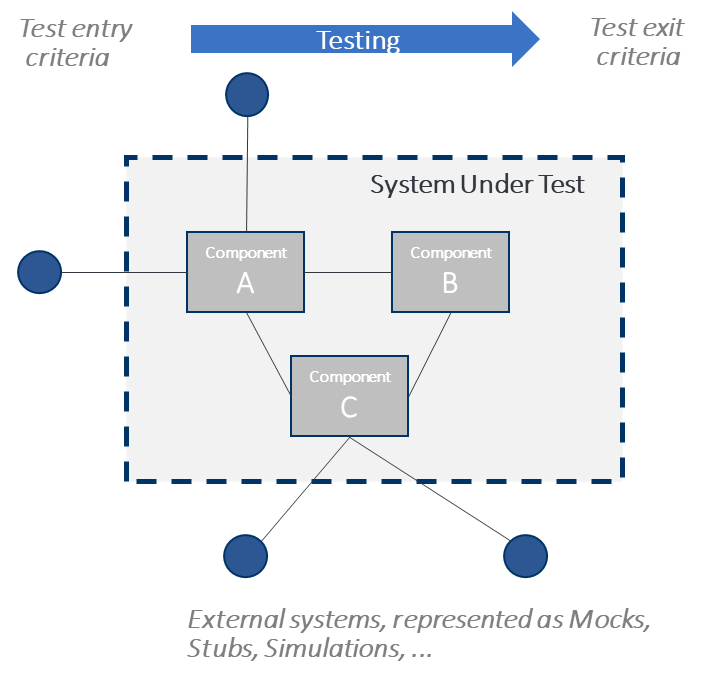
Components outside the SUT boundary but required for the stage to run must be handled explicitly – through mocking or stubbing in software systems, or through hardware-in-the-loop simulation in cyber-physical systems. The choice of what to mock or simulate is a design decision with real consequences: a mock that does not accurately represent the real component’s behavior means that interface will not be tested until a later, more expensive stage. Making the SUT boundary explicit in the Assembly Line model makes visible where the gaps in test coverage are – and creates a shared understanding across teams of what has and has not been validated at each point in the flow.
The test environment is also part of the SUT boundary. A stage that runs against an environment that differs significantly from production will miss defects that only appear under realistic infrastructure, load, data, or external system conditions. Environment congruity – the degree to which the test environment matches the production environment – is therefore a deliberate design decision at each stage. The further right a stage sits in the Assembly Line, the higher the expected congruity. Defects that repeatedly surface only in staging or production are a strong signal that congruity at earlier stages is insufficient.
A good test strategy is not a document that exists independently of the development process – it is reflected directly in the structure of the Assembly Line. The stages, their SUT boundaries, and the activities within each box collectively define where learning happens and at what cost. Defect Escape Rate and Defect Resolution Time provide direct feedback to that strategy: a high escape rate at a given stage signals that defects are not being caught where they should be, and a high resolution time signals that the system is taking too long to recover once they are found. Both metrics point back to the Assembly Line as the place where the response belongs – whether that means adding a stage, adjusting a SUT boundary, strengthening the activities within a box, or shortening feedback cycles. The Assembly Line is not just a model of the current state; it is the primary tool for designing and improving the test strategy over time.
The Assembly Line as a Design Tool
The boxes and circles of the Assembly Line are more than a notation system. Each modeling decision — what activities to show, how much detail to include, where to draw the boundary of a stage, how strict to set the acceptance criteria — reflects a deliberate choice about what to make visible and why. A model that serves its purpose well does not show everything. It shows what is needed to understand, diagnose, or improve the system at hand.
The visual language introduced in this article – blue circles for activities, green circles for quality gates, red arrows for feedback cycles, orange borders for human approvals, and dotted purple arrows for external dependencies – provides a consistent vocabulary for making that work visible across teams, domains, and levels of scale. The same pattern applies whether the stage describes a single component build, a safety-critical automotive approval sequence, or a full system integration. The schema does not change; only the activities and their context do.
In practice, the Assembly Line is typically used in two modes. A current state model captures how work actually flows today – the real activities, the real sequence, the real feedback cycles, and the real dependencies, including external ones. Modeling the current state as it actually is, rather than as it is assumed to be, is often the most revealing step: external dependencies become visible as flow inhibitors, acceptance criteria that are too strict or too loose become discussable, and stages that are too long or too broad become candidates for redesign. The current state model does not just document the present – it almost always generates ideas for the future state. A future state model then captures how work should flow, with improved stages, better-placed quality gates, internalized dependencies, and organizational boundaries that support rather than constrain flow.
Used well, the Assembly Line is therefore not a static picture but an active instrument for designing and continuously improving the development system. The metrics that measure its performance – Deployment Frequency, Defect Escape Rate, Defect Resolution Time, and Feedback Cycle Times – feed directly back into the model, making it the natural starting point for every improvement conversation.
Notes & References
- The sequence of activities within a stage depends heavily on the context. In this example, the smoke test runs before the full test environment is set up, as it can be executed against a minimal or already available environment at lower cost. If the smoke test fails, the investment in setting up the full environment is avoided. In other contexts, environment setup may need to come first. The Assembly Line model does not prescribe a fixed sequence – it makes the chosen sequence explicit and visible. ↩︎
Author: Peter Vollmer – Last Updated on April 9, 2026 by Peter Vollmer