Optimizing Value Streams
Along the Assembly Line
– From System Questions to Metrics and Learning –
Intro
The purpose of this article is to provide a structured approach to value stream optimization by introducing the key system questions and metrics used to observe and improve development value streams when applied along the Assembly Line. Rather than presenting metrics in isolation, the article explains how questions and metrics work together to make system behavior visible and guide learning and improvement over time.
It complements the existing guidance on Value Stream Measurement and Using the Assembly Line Approach for Value Stream Optimization by focusing on how metrics act as system-level signals within a broader optimization framework.
A key distinction made throughout the article is between:
- KPIs (Key Performance Indicators), which summarize outcomes and support steering and decision-making
- Diagnostic metrics, which are used to analyze system behavior, identify bottlenecks, and guide value stream optimization.
How Metrics Work Together
Metrics in a value stream serve different purposes depending on where they are observed and which system behavior they make visible. No single metric is sufficient to understand or optimize a complex value stream. Meaning emerges from how metrics relate to each other along the flow of work and across stages of the Assembly Line.
From an Assembly Line perspective, metrics are best grouped by the system questions they help answer, rather than by organizational ownership, tooling, or reporting cadence. This makes explicit that metrics are not standalone signals, but part of a coherent observation system.
At a high level, the metrics discussed in this article address four recurring optimization questions:
- Flow – How smoothly does work move through the value stream, and where does it slow down or stall?
- Quality – Where are defects introduced, detected, or escaping intended feedback stages?
- Stability – How does the system behave under load, and how effectively does it recover from disturbances?
- Learning – How quickly does feedback lead to insight and improvement?
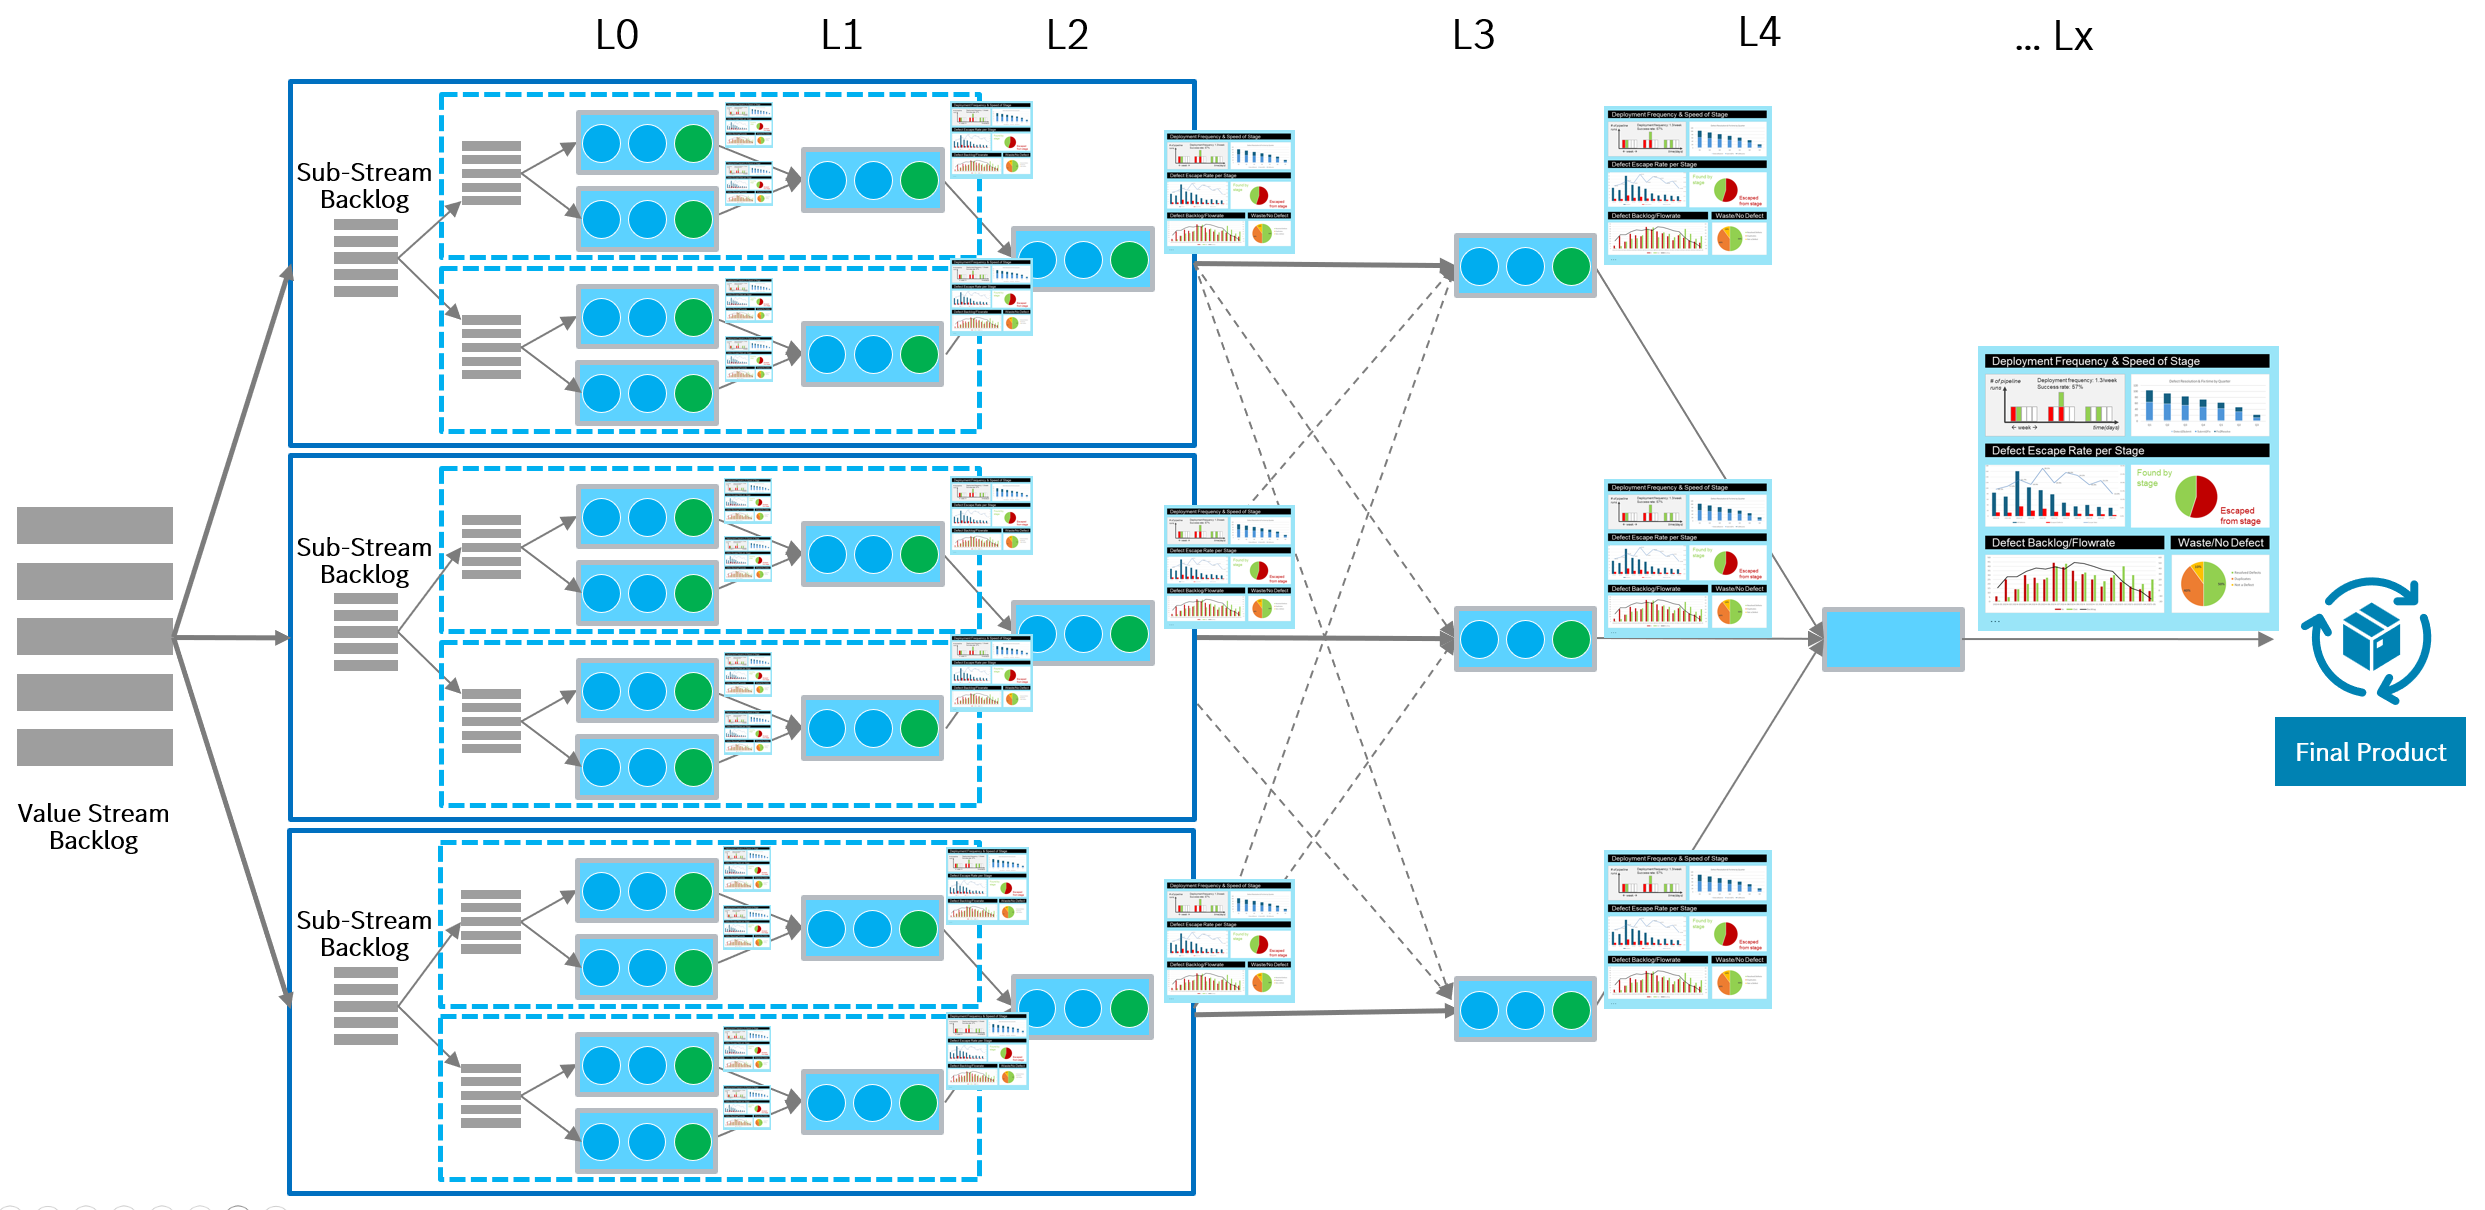
Each metric provides visibility into one or more of these dimensions, but always from a specific position along the Assembly Line. Some metrics observe entry and intake, others focus on movement between stages, handovers, defect detection, or recovery and stabilization. As illustrated, the same value stream can be observed simultaneously through multiple complementary metric views at different levels and stages.
Importantly, these metrics are complementary, not interchangeable. For example, improving flow without understanding quality signals can increase downstream rework. Optimizing recovery speed without addressing upstream detection can mask structural issues. Interpreting metrics in isolation therefore leads to local optimization.
Set of Complementary Metrics Along the Value Stream
The Assembly Line provides a shared structure for placing metrics in context. By mapping metrics to stages, handovers, and feedback loops, it becomes possible to understand what part of the system a metric is actually observing, and how multiple metrics together describe system behavior across the value stream.
As shown in the illustration, metrics can be applied at different observation levels – from end-to-end value stream outcomes to cross-stage interactions and stage-level execution – without changing their fundamental meaning. What changes is their role: aggregated views act as system-level indicators, while more granular views explain causes and guide improvement.
The following sections use this Assembly Line structure to position the individual metrics, showing:
- where they observe the value stream,
- which performance parameters they illuminate,
- and how they work together to support system-level optimization.
Metrics in Context: Assembly Line, Flow Metrics, and DORA
Metrics used in value stream optimization are often introduced through different frameworks and perspectives. While this can create the impression of overlapping or competing metric systems, these approaches largely address different aspects of the same underlying system.
The Assembly Line perspective provides a structural context in which these metrics can be placed and interpreted consistently.
Relationship to DORA Metrics
The metrics popularized through DevOps Research and Assessment (DORA) focus on the end-to-end performance of the software delivery value stream and its outcomes. DORA research consistently shows that software delivery and operational performance are strong predictors of organizational success, extending beyond commercial outcomes to areas such as reliability and well-being.
DORA’s Four Key Metrics observe two fundamental aspects of the same development value stream:
- the feature delivery aspect, captured primarily through lead time and deployment frequency
- the recovery aspect of the development value stream, captured through change failure rate and recovery time
These metrics are intentionally outcome-oriented. They answer questions such as:
- How quickly can the system recover when something goes wrong?
- How efficiently does the development value stream deliver flow items to production?
- How reliable is delivery?
From an Assembly Line perspective, DORA metrics observe the system largely at its boundaries – from commit to production and from failure to recovery. They are well suited for benchmarking, executive steering, and tracking overall delivery performance, but they provide limited insight into where inside the value stream friction, delay, or waste is created.
The Assembly Line metrics described in this article do not replace DORA metrics. Instead, they extend and contextualize them by attaching diagnostic signals to specific stages, handovers, and feedback loops within the value stream.
Used together, DORA metrics define the external outcome envelope of the development value stream, while Assembly Line metrics provide both:
- outcome visibility at the system level, and
- internal resolution for analysis and optimization.
This dual role makes Assembly Line metrics a central element of a coherent measurement system – connecting outcome steering with evidence-based improvement.
Relationship to Flow Metrics (Kersten and SAFe)
Flow metrics have gained broad adoption through the work of Mik Kersten1, who positioned flow as the central lens for understanding and improving modern software development and delivery systems. His work emphasized that optimizing individual activities or teams is insufficient; performance emerges from how work flows through the system end to end.
The Scaled Agile Framework (SAFe) adopted and operationalized these ideas by introducing a standardized set of Flow Metrics for large-scale environments2. SAFe explicitly introduced Flow Predictability as a system-level measure.
| Flow Metric | Short Definition | Primary Question Answered |
|---|---|---|
| Flow Time | The elapsed time a flow item takes from start to completion across the development value stream. | How long does it take for work to flow through the system end to end? |
| Flow Load | The amount of work in progress within the development value stream over time. | How much work is currently in the system, and where is it accumulating? |
| Flow Distribution | The proportion of different types of flow items (e.g. features, defects, risks, debt) being worked on. | What kind of work is the system spending its capacity on? |
| Flow Velocity | The rate at which flow items are completed over a given time period. | How much work does the system complete per unit of time? |
| Flow Efficiency (derived) | The ratio of active work time to total flow time. | How much of the elapsed time is actually spent creating progress? |
| Flow Predictability (SAFe) | The degree to which planned work is delivered as expected within a time horizon. | How reliably does the system deliver what was planned, when it was planned? |
Flow metrics focus on the movement of flow items through the development value stream. They make visible how work progresses, where it accumulates, and how predictably it is completed. As such, they are primarily concerned with flow behavior, not with the internal causes of delay or waste.
At an aggregated level, Flow Metrics provide strong outcome signals. They summarize how effectively the system moves work from start to completion and how reliably it delivers what was planned. In this role, metrics such as Flow Time, Flow Velocity, and Flow Predictability can be used as KPIs for value stream steering.
However, Flow Metrics are largely agnostic to structure. They describe what happens to work as it flows, but not where inside the value stream delays, queues, or disruptions are introduced. For example, an increase in Flow Time indicates that work is taking longer to complete, but does not reveal whether this is caused by upstream intake issues, mid-stream handovers, late-stage testing, or deployment constraints.
Flow Metrics in the Assembly Line Context
The Assembly Line perspective provides the structural context needed to interpret Flow Metrics more precisely. While Flow Metrics describe the behavior of flow items end to end, the Assembly Line makes explicit which stages, cross-stage handovers, and feedback loops that flow passes through.
Mapped onto the Assembly Line, Flow Metrics can be observed at different levels:
- At the value-stream level, they summarize overall flow performance and support outcome-oriented steering.
- At the Cross-Stage level3, the same metrics become diagnostic signals for handovers and synchronization, revealing where work accumulates, where variability increases, and where predictability begins to break down.
- At the Stage level, they expose local execution issues, queues, and delayed feedback that shape end-to-end flow.
For example, increased Flow Load at the Value Stream level indicates growing work-in-progress, while Cross-Stage and Stage-level views show where queues are forming. Similarly, reduced Flow Predictability signals planning instability at the system level, while more granular views reveal whether this instability originates from late discovery of work, delayed fix propagation, or misaligned test execution.
In this way, Flow Metrics align naturally with the Assembly Line model. They describe how work flows, while the Assembly Line explains where and why that flow is shaped.
Value Stream Metrics – Questions, Levels, and Intended Use (VST Guidance)
The system questions and metric tables in this section operationalize the value stream performance parameters by translating intent into observable system behavior at the appropriate level and for the appropriate purpose. Performance parameters define what “better” means for a value stream – such as improving Time to Market, Quality, or Productivity. The system questions focus attention on concrete aspects of flow and feedback, and the metrics provide the signals needed to observe, learn, and reason about system behavior.

The Typical Level of Use indicates where in the system a metric provides meaningful insight – at the Value Stream level for end-to-end outcomes, at the Cross-Stage level for handoffs and synchronization, or at the Stage level for local execution and feedback. The Primary Use clarifies how the metric should be used: as a KPI for steering and alignment, as an optimization metric for diagnosis and improvement, or as a situational risk indicator. Together, this structure enables a systematic and well-scoped approach to value stream optimization by making intent, observation, and learning explicit. At the value stream level, many metrics act as early indicators that trigger deeper analysis; cross-stage and stage-level views then explain causes and guide improvement.
How efficiently does the development value stream deliver usable increments?
This question focuses on the system’s ability to turn intent into usable outcomes at a sustainable pace. It looks beyond local productivity and asks how smoothly work flows through the entire Development Value Stream, from intake to release. Efficiency here is not about maximizing output at individual stages, but about minimizing delays, queues, and friction that slow down end-to-end delivery. The metrics in this section therefore combine outcome-oriented signals at the value stream level with diagnostic views at cross-stage and stage level, allowing teams to detect flow problems early and identify where in the Assembly Line delivery efficiency is constrained.
|
Metric |
Typical Level of Use |
Primary Use |
Comment/Guidance |
|---|---|---|---|
|
Value Stream · Cross-Stage · Stage |
KPI → Optimization |
KPI when aggregated end-to-end; diagnostic between stages to expose feedback delays and pipeline constraints. |
|
|
Flow Time |
Value Stream · Cross-Stage · Stage |
KPI → Optimization |
Core end-to-end outcome metric; stage breakdown reveals queues, waiting, and handoffs. |
|
Flow Velocity |
Value Stream · Cross-Stage · Stage |
Optimization |
Shows throughput changes; not suitable as a standalone KPI. |
How stable and reliable is delivery?
Stability and reliability describe whether the Development Value Stream delivers usable outcomes consistently, not just occasionally. This question focuses on the system’s ability to absorb variability, execute changes safely, and maintain predictable behavior over time. The metrics in this section provide complementary perspectives on reliability: change-related failure signals how safely work is released, flow predictability reflects whether outcomes meet expectations, and defect escape shows whether quality issues are detected at the intended stages. Together, they make reliability observable as a system property across the value stream.
This questions implies:
- Does the system behave consistently over time?
- Can we trust handoffs and releases?
- Do changes work as intended?
|
Metric |
Typical Level of Use |
Primary Use |
Comment/Guidance |
|---|---|---|---|
|
Change Failure Rate |
Value Stream · Cross-Stage · Stage |
KPI → Optimization |
System reliability KPI; lower levels show where failures are introduced. |
|
Flow Predictability |
Value Stream · Cross-Stage · Stage |
KPI → Optimization |
Outcome-oriented predictability; lower levels explain deviations. |
|
Value Stream · Cross-Stage · Stage |
KPI → Optimization |
Final-stage escape rate reflects end-to-end quality; earlier stages reveal feedback gaps. |
How quickly does the development system detect, analyze, and resolve problems?
In Development Value Streams, issues such as defects, integration problems, or wrong assumptions are a normal part of the learning process. The metrics in this table therefore focus on how effectively the development system detects, analyzes, and resolves problems as work flows through it, and how quickly feedback leads to correction and improvement. They describe learning speed, flow, and decision quality within development. Metrics that focus on restoring a running system after an incident belong to operations and are not covered here, even though faster learning and resolution in development contribute directly to more reliable operations downstream.
|
Metric |
Typical Level of Use |
Primary Use |
Comment/Guidance |
|---|---|---|---|
|
Value Stream · Cross-Stage · Stage |
KPI → Optimization |
Overall learning-speed indicator; stage view exposes queues, handoffs, and late resolution. |
|
|
Feedback Cycle Time |
Value Stream · Cross-Stage · Stage |
Optimization |
Core shift-left metric; shorter cycles indicate faster learning and earlier detection. |
|
Reopen Rate |
Value Stream · Cross-Stage · Stage |
Optimization |
Indicates that issues were not fully resolved, validated, or understood, often due to incomplete validation, unclear expectations, communication gaps, or changes in context4. |
How much work is in the system, and where does it accumulate?
Work in progress (WIP) is one of the strongest predictors of flow performance. When too much work is in the system, flow slows down, feedback is delayed, and quality risks increase. This question focuses on how much work the Development Value Stream is currently carrying and where it accumulates, because accumulation is never neutral: it indicates overload, waiting, or unresolved issues. The metrics below make different aspects of WIP visible – from overall system load, to quality-related accumulation, to work that is aging and no longer flowing – helping identify congestion points and prioritize stabilization and improvement efforts.
|
Metric |
Typical Level of Use |
Primary Use |
Comment/Guidance |
|---|---|---|---|
|
Flow Load |
Value Stream · Cross-Stage · Stage |
KPI → Optimization |
WIP KPI at system level; stage view shows overload and local congestion. |
|
Defect Backlog |
Value Stream · Cross-Stage · Stage |
Optimization |
Quality-related WIP and release risk indicator; size, age, and location matter. |
|
Aging WIP |
Value Stream · Cross-Stage · Stage |
Optimization |
Strong leading indicator for stalled work and flow risk. |
What type of work consumes system capacity?
Not all work flowing through a Development Value Stream contributes equally to customer value or long-term outcomes. This question focuses on how the system’s capacity is actually used and whether effort is spent on new functionality, quality improvements, risk reduction, or unplanned rework. Understanding the distribution of work is critical because it reveals strategic trade-offs, hidden sources of waste, and shifts in system behavior over time. The metrics in this section make visible where capacity is invested and help assess whether the current mix of work supports sustainable flow, quality, and learning.
|
Metric |
Typical Level of Use |
Primary Use |
Comment/Guidance |
|---|---|---|---|
|
Flow Distribution |
Value Stream · Cross-Stage · Stage |
Optimization |
Shows investment mix (features, defects, debt, risk). Not a KPI. |
|
Value Stream · Cross-Stage · Stage |
Optimization |
Reveals capacity drain caused by non-value-adding work. |
Where is feedback delayed, weak, or ineffective?
Fast and effective feedback is essential for learning and flow in a Development Value Stream. This question focuses on where feedback takes too long, arrives too late, or fails to detect problems at the intended stage. Delayed or weak feedback increases rework, prolongs learning cycles, and shifts defect discovery downstream, where fixes become more expensive and disruptive. The metrics in this section help identify gaps in feedback loops, assess the effectiveness of quality gates, and guide improvements that move detection and learning earlier in the value stream.
|
Metric |
Typical Level of Use |
Primary Use |
Comment/Guidance |
|---|---|---|---|
|
Feedback Cycle Time |
Value Stream · Cross-Stage · Stage |
Optimization |
Longer cycles indicate delayed learning and late problem detection. |
|
Value Stream · Cross-Stage · Stage |
KPI → Optimization |
Identifies where defects bypass intended quality gates. |
Where does waste and noise enter the system?
Not all incoming work represents real problems or opportunities for improvement. This question focuses on where effort enters the Development Value Stream without leading to product change or customer value. Noise and waste consume capacity, slow down feedback, and obscure the issues that truly matter. Used as a diagnostic signal, metrics such as the Non-Defect Ratio support informed decisions about feedback mechanisms, test strategy alignment, and fix propagation across stages. In this role, they become practical navigation aids for reducing waste, improving feedback quality, and strengthening end-to-end flow.
|
Metric |
Typical Level of Use |
Primary Use |
Comment/Guidance |
|---|---|---|---|
|
Non-Defect Ratio |
Value Stream · Cross-Stage · Stage |
Optimization |
Aggregated trend indicates system-wide feedback noise; lower levels identify sources and causes. |
|
Value Stream · Cross-Stage · Stage |
Optimization |
Rising values signal systemic feedback issues; stage views reveal missing transparency or weak fix propagation. |
Where do bottlenecks and handover issues occur?
Bottlenecks and handover issues emerge where work loses momentum due to coordination, dependencies, or synchronization between stages. This question focuses on identifying where flow slows down not because of too much work in the system, but because work is waiting, queued, or blocked at stage boundaries. Understanding these delays is critical, as they often dominate end-to-end flow time and are invisible when only looking at local efficiency or workload. The metrics in this section make time lost to handovers and waiting explicit and support targeted improvements to stage interactions and flow continuity.
|
Metric |
Typical Level of Use |
Primary Use |
Comment/Guidance |
|---|---|---|---|
|
Flow Time (by stage) |
Cross-Stage · Stage |
Optimization |
Identifies queues, handoffs, and synchronization delays – in and between stages. |
|
Queue / Waiting Time |
Cross-Stage · Stage |
Optimization |
Makes delays caused by dependencies and handovers explicit. |
Is the system delivering what was planned?
Delivery against plan can be assessed in different ways, depending on whether the focus is on outcomes or outputs. This question therefore distinguishes between Flow Predictability and Plan vs Actual, which serve related but different purposes. Flow Predictability reflects whether the Development Value Stream delivers the outcomes that were expected over a planning horizon, making it suitable as a system-level steering signal. Plan vs Actual, in contrast, focuses on whether planned work items were completed as expected and is therefore closer to an output-oriented view. Together, these metrics provide complementary insight: one into how reliably the system produces intended outcomes, and the other into where planning assumptions and execution diverge.
|
Metric |
Typical Level of Use |
Primary Use |
Comment/Guidance |
|---|---|---|---|
|
Flow Predictability |
Value Stream · Cross-Stage · Stage |
KPI → Optimization |
KPI at system level; lower levels explain deviations. |
|
Plan vs Actual |
Value Stream · Cross-Stage · Stage |
KPI → Optimization |
KPI at aggregate planning levels; lower levels explain deviations and planning assumptions. |
Where does the system invest in work that is later abandoned – and how late is that learning?
Cancellation of work is a learning signal, but the timing of that learning matters. This question focuses on where the system invests in work that is later abandoned and how late those decisions are made. Early cancellation indicates fast learning and effective feedback, while late cancellation represents waste and unnecessary system load. The metrics in this section make visible how and where learning is delayed, helping improve decision quality and reduce avoidable effort.
|
Metric |
Typical Level of Use |
Primary Use |
Comment/Guidance |
|---|---|---|---|
|
Backlog Item Cancellation Rate |
Value Stream · Cross-Stage · Stage |
Optimization |
Cancellation is learning; late cancellation is waste. |
|
Cancellation Stage Distribution |
Cross-Stage · Stage |
Optimization |
Shows how late decisions are made in the value stream. |
Conclusion
Metrics play a critical role in value stream optimization, not by prescribing solutions, but by making system behavior visible and comparable over time. The system questions introduced in this article can already guide meaningful improvement before metrics are fully established, relying on the judgment and experience of the people working in the value stream. In Stage 1 and Stage 2 of the Value Stream Lifecycle, optimization is often exploratory and experience-driven: asking the right questions about flow, quality, stability, and learning frequently leads to effective local and cross-stage improvements even without comprehensive measurement. As the value stream reaches Stage 3, optimization becomes systematic and sustained, and metrics provide the shared evidence needed to validate assumptions, compare alternatives, and track progress over time. Positioned along the Assembly Line, metrics then connect performance intent with observability and learning, enabling deliberate improvements across the Development Value Stream.
Notes & References
- Kersten, Mik. Project to Product: How to Survive and Thrive in the Age of Digital Disruption. IT Revolution Press, 2018. ↩︎
- https://framework.scaledagile.com/measure-and-grow ↩︎
- A metric is cross-stage whenever it observes interaction between stages rather than execution within a single stage or outcomes of the entire value stream. ↩︎
- Context change: The conditions under which a fix was made or validated have shifted by the time it is used or integrated (e.g. different integration partners, environments, data, or usage patterns).
Example: A defect is fixed and validated in a component test environment, but reappears after integration because another component was updated or the interaction sequence changed. ↩︎ - Defect backlog as risk indicator: The size, age, and composition of the defect backlog indicate release risk. Large or growing backlogs – especially with late-stage, severe, or critical defects – increase the likelihood of releasing low-quality increments. This supports release decisions (go/no-go) but is not a performance KPI. ↩︎
Author: Peter Vollmer – Last Updated on Januar 23, 2026 by Peter Vollmer