Why the Way You Visualize Value Streams Matters
This article explores how value streams can be visualized. Unlike models locked in mass production thinking, the Assembly Line Model embraces the specific characteristics of modern product development. And this matters – because the way you visualize your value streams decides what you see and how you act.
„All models are wrong, but some are useful.“ – George Box
Visualization is Modeling
When we visualize a value stream, we are always creating a model. A model simplifies reality by selecting certain aspects, abstracting details, and representing them in a useful way. As George Box noted, “All models are wrong, but some are useful.” The usefulness of a model lies in what it highlights, not in capturing every detail. A good model makes complex systems easier to understand. It helps people see the most relevant aspects, engage in meaningful discussions, and build a common understanding. In the context of value streams, the right model clarifies purpose, reveals strengths and weaknesses, and points to opportunities for improvement. Most importantly, it enables better decisions about how to set up the stream – how to organize around value and optimize flow – so that outcomes are delivered faster, with less effort, and at higher quality.
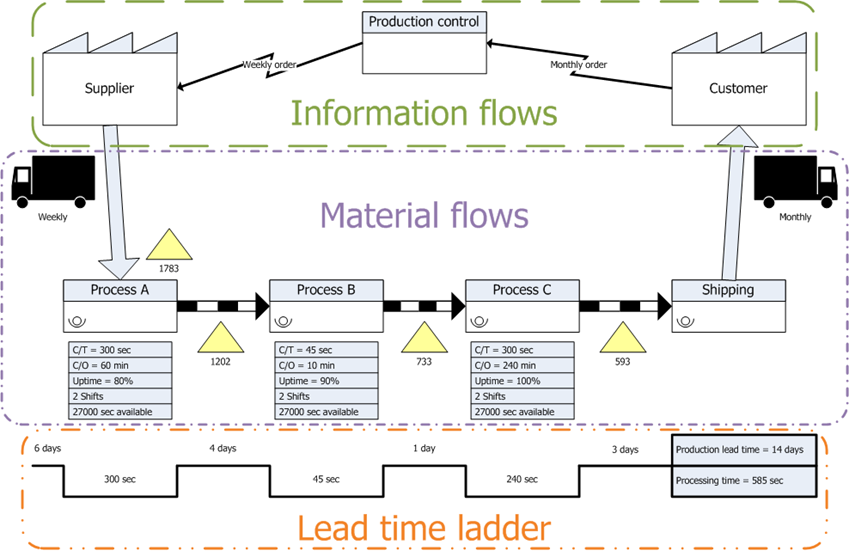
Taking a historical view helps explain why different modeling approaches emerged and evolved. Traditional lean models, such as the material and information flow map – originally developed at Toyota and later documented by Mike Rother and John Shook1 in Learning to See – provided the foundation. Morgan and Liker2 adapted the mass-production model into a lean product development approach, which was later refined with elements like swim lanes, influenced by business process mapping practices.3 In turn, the DevOps community adapted these models to fit its context. Yet, despite these advances, most approaches remained rooted in the original mass-production mindset.4
A new Model tailored for Prodcut Development
Yet, despite their differences, these models remain anchored in the mass production paradigm. They emphasize repeatability and efficiency but fall short of addressing the dynamics of modern product development. While each model can still serve a purpose in the right context, the real question is: how well do they align with today’s iterative and incremental approaches? To explore this, it helps to contrast the assumptions of the mass production mindset with those of the product development mindset.
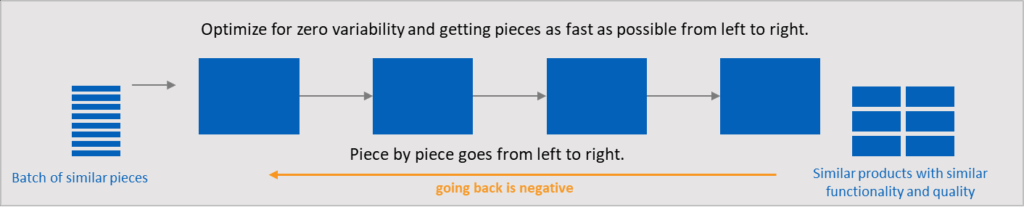
Traditional value stream mapping originates from manufacturing, where the goal is to produce consistent batches of similar items on a production line. At the end of the process, you expect a uniform set of nearly identical products. In this context, going back to a previous station is seen as a failure – it indicates that a part deviates from the standard, introducing unwanted variability into an otherwise controlled and repeatable process.
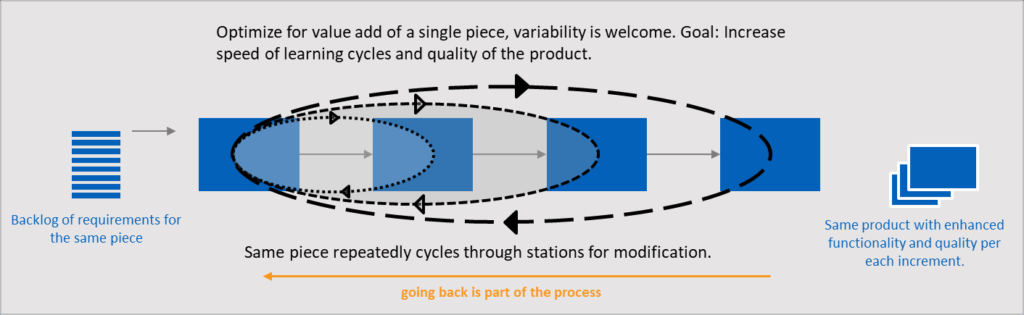
But software and cyber-physical development doesn’t follow the rules of mass production. We’re not producing batches of identical items – instead, we’re evolving a product that adapts, expands, and improves over time. Features, bug-fixes, and enhancements are added incrementally or in parallel, and the product gains new capability as it moves through the development process. The result is not a collection of uniform outputs, but a product that continuously evolves in response to learning and market insights. Iteration is not rework – it is the engine of progress, often leading to better solutions, deeper understanding, and higher quality. This kind of positive variability – where ideas improve as they are tested and refined — is not just accepted; it is essential. To make this possible, product development relies on short feedback cycles, smaller batch sizes, and reduced transaction costs, all of which improve flow and accelerate economic decision-making. Shift-left practices further strengthen these loops by bringing testing, quality, security, and compliance earlier into the process – building quality in from the start. Together, these practices enable faster learning, higher quality, and the continuous delivery of value to customers.
Finding the right Model for Product Development
Creating an effective model for software and cyber-physical product development requires accounting for the unique characteristics of these domains. Unlike traditional manufacturing, they operate in dynamic, iterative, and largely invisible6 environments. A detailed explanation of the proposed Assembly Line Model – which addresses these challenges – is provided in the whitepaper Reimagining Value Stream Mapping: A Fresh Approach for Software and Cyber-Physical Systems, as well as in several purpose-driven articles on this website Assembly Line for Value Stream Identification and Assembly Line for Value Stream Optimization. This article provides a high-level overview to support an initial understanding of the model. The Appendix includes a comparison table outlining the different approaches, their key characteristics, and guidance on where each is most applicable.
A short Description of the Assembly Line Model
The assembly line serves as a simplified model of a typical product development process, structured around its main phases.
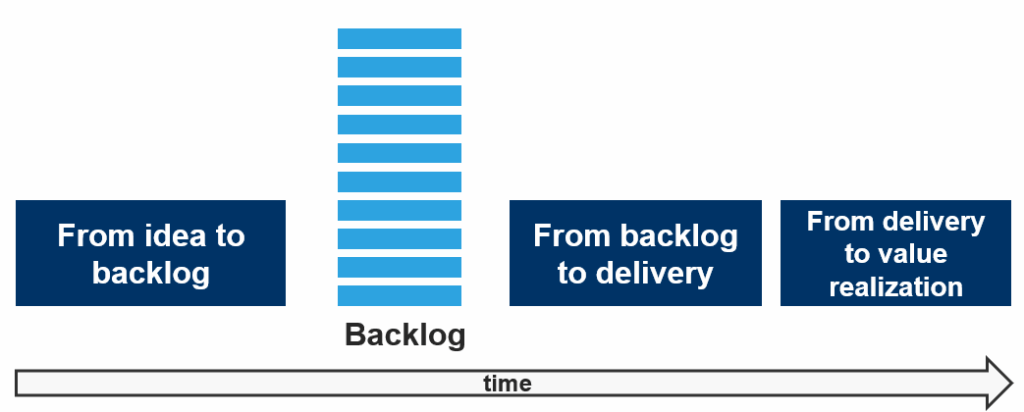
- From Idea to Backlog: This phase encompasses the process of defining what the product should achieve – whether through requirements, specifications, user stories, or other forms of description. It translates strategic intent into actionable items.
- Backlog: The backlog serves as a prioritized (ranked) list of work items, representing a structured set of instructions for what should be built next. In bigger systems, this could also be a cascade of backlogs at different levels.
- From Backlog to Delivery: This phase covers the actual development work – designing, implementing, testing, and preparing the product for release. It is the heart of the product creation process.
- From Delivery to Value Realization: Simply delivering a product does not automatically generate value. Value is only realized when the product is deployed, adopted, and used effectively by end users – fulfilling its intended purpose (or in some cases, delivering unexpected outcomes).
In this context, we will focus on two key segments: Backlog(s) and From Backlog to Delivery. These phases represent the core of the development flow and often present the greatest modeling challenges. While the surrounding phases are also important, we will provide separate guidance for them as needed.
“The customer experience is the music you hear. The developed and assembled hardware and software are what make that experience possible – that is the product, in this case a music player.”
1 – Identifying the product (value delivery): The first – and often more challenging than expected – step is gaining a clear understanding of the product being delivered and the nature of the final hand-off. When analyzing a value stream, defining its scope is essential: where does responsibility begin, and where does it end?
A common pitfall is thinking about the product solely in terms of what the user can accomplish with it. While user outcomes are important, they don’t necessarily help us model how the product is developed. Instead, we need to focus on what is actually handed off at the end of the development process.
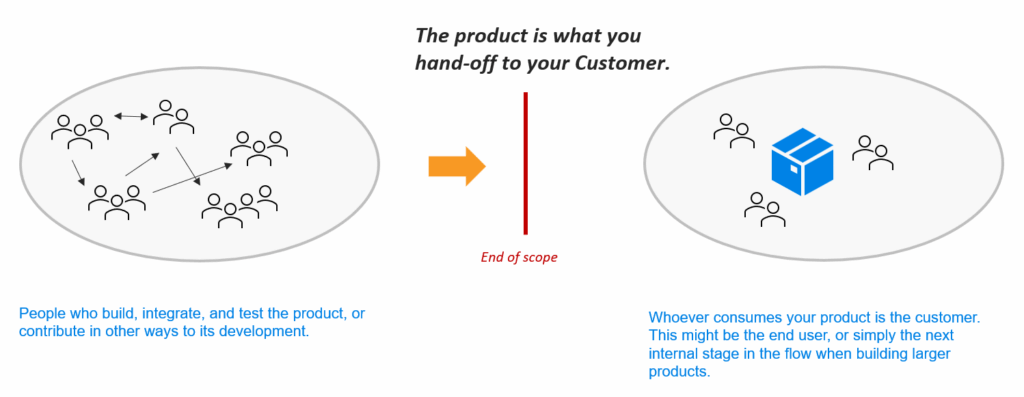
In a straightforward software example, this might be a fully documented and tested software package. In the case of cyber-physical systems, it could involve both hardware and the embedded software that controls it.
In very large and complex environments, a single value stream can become so extensive that it must be partitioned into smaller, more manageable value streams. In such cases, the value stream under observation typically delivers a sub-product – a component or capability that contributes to a larger system. The final end product is then an aggregation of many such sub-products, each developed and delivered through its own dedicated value stream7.
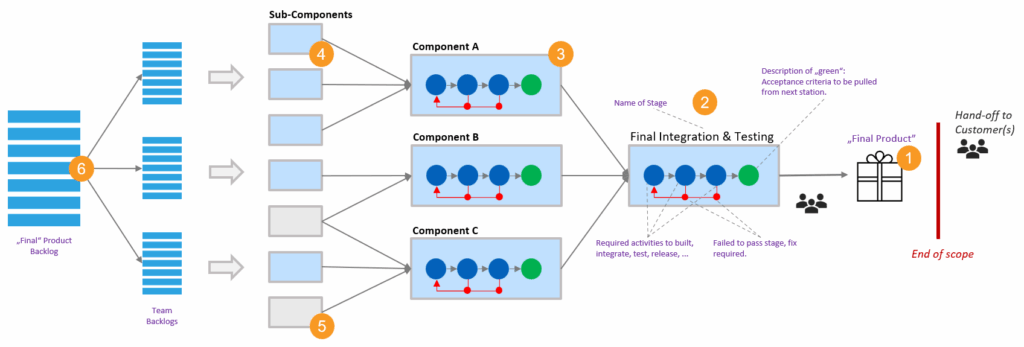
2 – Final integration & testing: Once the product has been identified, we can begin visualizing the value stream. The key question at this stage is: What components are integrated to build the final product, and what must happen to make it ready for delivery (as defined in step 1)?
This phase is typically illustrated by the blue circles in the diagram box. These represent activities such as component release management8, integration/build processes, and various forms of testing (e.g., system, performance, compliance).
The green circle at the end represents the acceptance criteria and the definition of done9 – the point at which the integrated product is considered ready for hand-off or release, aligning with the delivery expectations outlined in step 1.
3 – Assembled components: While step 2 focused on the activities required to integrate components into a final product, this step identifies and describes the components themselves that are being assembled. For each of these components, we then recursively examine how they are constructed from their own sub-components.
4 – Stop decomposition: This decomposition continues until we reach a sufficient level of detail – where further breakdown no longer adds meaningful insight or value.
5 – Suppliers: The same principle applies to supplier-delivered components: in many cases, their internal structure is either unknown or irrelevant to the modeling effort, and can therefore be treated as black boxes within the value stream.
6 – Backlogs: New feature development and other changes are typically driven by backlogs. As products or systems grow in complexity, this often results in a cascade of interconnected backlogs.10 In more traditional development processes, this phase may look quite different, relying instead on formal requirements and specifications. For this example, we focus on a value stream centered around backlogs. Since detailed backlogs are usually team-specific, we’ve represented them here using broad arrows to indicate assignment to the components11. A real-world example will follow, providing more detail.
The Ability to Measure What Matters
Agile product development depends on fast feedback, small batch sizes, and shift-left practices. But without the right model, it’s difficult to measure whether these improvements actually make a difference. This is where the Assembly Line approach shows its real strength: it creates a structured way to measure what matters across the entire value stream. By breaking development into clear stages, it becomes possible to track flow and quality metrics consistently, identify bottlenecks, and see where learning cycles slow down.
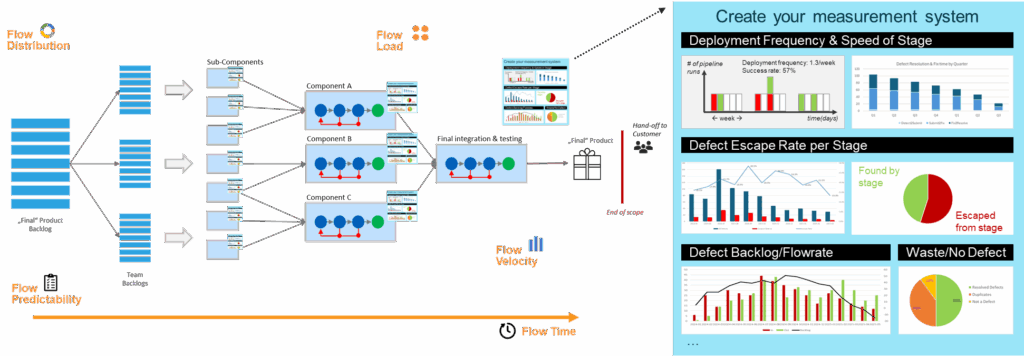
And this doesn’t stop at the level of a single stage. The same principles apply at different scales: each step of a value stream, the end-to-end value stream, and even across value stream landscapes in large organizations. At every level, the Assembly Line provides the scaffolding for meaningful measurement – from flow time in a single stage, to velocity across the whole stream, to system-level bottlenecks revealed in a landscape view. This makes it possible to compare, align, and improve not just isolated processes but the entire way value flows through the enterprise.
Unlike traditional models rooted in mass production, the Assembly Line doesn’t just count outputs – it monitors the health of the feedback system itself. Flow metrics such as flow time, efficiency, load, velocity, distribution, and predictability make visible how fast and reliably value moves through the stream. Quality metrics – from defect backlog and flow rate to escape rate and mean time to repair – show whether teams are building quality in or relying on downstream correction.
Together, these measures give a balanced picture of speed, quality, and productivity. They allow organizations to see whether reducing transaction costs, working in smaller batches, or applying shift-left practices truly accelerate learning and value delivery. In short, the Assembly Line makes systematic improvement measurable – whether at the level of a team, a single value stream, or the landscape of value streams that powers the entire enterprise.
Conclusion
Visualizing value streams goes far beyond drawing diagrams – it is about creating models that shape how we understand, discuss, and improve the flow of value. Every visualization is a form of modeling, and the model you choose fundamentally influences what you see and how you act.
Traditional approaches rooted in manufacturing provided important foundations, but they fall short when applied directly to the dynamic, iterative, and feedback-driven nature of modern product development. Software and cyber-physical systems evolve continuously; iteration is progress, not failure. In this context, effective visualization must highlight feedback loops, learning cycles, and the practices that enable them – smaller batch sizes, reduced transaction costs, and shift-left approaches that build quality in from the start.
The Assembly Line Model addresses this need by offering a structured yet flexible way to represent how value truly flows in product development. It simplifies complexity without oversimplifying reality, making it possible to model not only individual stages but also entire value streams – and even landscapes of interconnected streams in large organizations. Crucially, it also creates the ability to measure what matters: flow and quality metrics that reveal whether improvements in feedback speed, efficiency, and quality are actually taking hold.
Ultimately, the right visualization is the one that reduces complexity to the level required, fosters shared understanding, and guides meaningful action. With the Assembly Line Model, organizations can see their value streams as living systems – measurable, improvable, and scalable – enabling faster learning, higher quality, and the continuous delivery of value to customers.
Appendix – Which Modeling Approach Fits Which Context
When looking across industries, we can distinguish three major approaches to modeling value streams.
- The Material & Information Flow Map, rooted in Lean mass production and popularized by Rother and Shook, focuses on visualizing physical product flows.
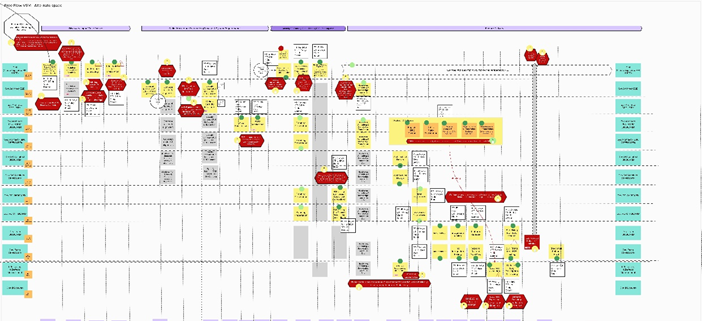
- The Product Development Value Stream Mapping (PD-VSM) method, described by Morgan and Liker, adapts Lean thinking to knowledge flows and cross-functional collaboration in product development.
- The more recent Assembly Line Model, often used in DevOps and digital contexts, addresses the unique characteristics of software and cyber-physical systems with iterative and feedback-driven workflows.
|
Criteria |
Material & Information Flow Map |
Product Development VSM (PD-VSM) |
Assembly Line Model |
|---|---|---|---|
|
Primary Application |
Physical goods produced in high volume with little variation. |
New hardware products where knowledge flow and cross-functional alignment are critical. |
Software or cyber-physical systems that evolve continuously and require frequent integration. |
|
Improvement Focus |
Eliminates visible waste: overproduction, inventory, waiting, transport. |
Reduces delayed learning, late decisions, rework, and lack of knowledge capture. |
Tackles bottlenecks, silos, long cycle times, and lack of automation; accelerates learning cycles. |
|
Process Characteristics |
Works best with stable, repeatable processes. |
Supports projects with high variation but leverages reusable knowledge and shared standards. |
Designed for iterative, non-linear, feedback-heavy workflows. |
|
Role of Standardization |
Strong: stabilizes processes and ensures predictable outcomes. |
Provides stable baselines (checklists, design standards) that enable creativity and reuse. |
Product-focused: standardization at subsystem or assembly level to enable flow across teams. |
|
Time Perspective |
Focus on flow efficiency and stable takt time. |
Focus on front-loading to prevent costly late-stage errors. |
Emphasizes rapid, continuous learning cycles (CI/CD, DevOps) to accelerate end-to-end performance. |
|
Organizational Setup |
Fits hierarchical, process-controlled organizations. |
Chief Engineer system with strong cross-functional collaboration. |
Organized around value streams and team topologies; suited for scaled DevOps/Agile. |
|
Goal |
Operational efficiency through waste elimination. |
Knowledge-driven innovation and better decision-making. |
Fast learning, innovation at scale, and continuous value delivery. |
|
When to Use |
When optimizing a manufacturing line or repetitive production process. |
When improving hardware product development and reducing wasted effort. |
When modeling complex, iterative systems (software, digital, cyber-physical) where feedback and integration dominate. |
Notes & References
- Rother, Mike, and John Shook. Learning to See: Value Stream Mapping to Add Value and Eliminate MUDA. Brookline, MA: Lean Enterprise Institute, 1999. ↩︎
- Morgan, James M., and Jeffrey K. Liker. The Toyota Product Development System: Integrating People, Process, and Technology. New York: Productivity Press, 2006. ↩︎
- If you have more information about the historic background of swim lanes in value stream mapping, please contact me. Current evidence suggests they were introduced by Rummler and Brache in Improving Performance: How to Manage the White Space on the Organization Chart (San Francisco: Jossey-Bass, 1990) as a way to clarify roles and responsibilities across functions and address performance gaps in the ‘white space’ between organizational units. ↩︎
- Another common high-level notation represents value streams with chevrons, used mainly for introductory or definitional purposes (as done in our article Types of Value Streams) to illustrate the major steps from the initial trigger to the delivery of value. The Scaled Agile Framework uses the Chevron representation as starting point of its Value Stream Identification. I am still looking for the origin of the chevron representation. ↩︎
- https://commons.wikimedia.org/w/index.php?curid=28553995 ↩︎
- Unlike in manufacturing, where each station and material flow is visible on the shop floor, much of software development happens in a less tangible environment. Many activities are carried out by individual developers or executed through automated pipelines, making the overall process far less visible and harder to observe directly. ↩︎
- In such cases, we often refer to a value stream landscape – a structured network of interconnected value streams, each delivering a sub-product or capability. Together, these value streams contribute to the development and delivery of the overall solution, with each playing a defined role within the broader system. ↩︎
- These represent activities such as selecting the components to be used, reviewing release notes to understand what’s new, identifying known issues, and gathering any other necessary information. ↩︎
- In this context, acceptance criteria are increment-specific conditions that define the minimum content and quality required. The definition of done, by contrast, serves as a general checklist for the increment, e.g., ensuring new features are documented and release notes are completed. ↩︎
- Especially in automotive and other cyber-physical environments, this part is typically addressed through systems engineering and involves several additional dimensions that need to be considered. ↩︎
- In the real world, backlog assignment depends on the chosen team topology. For component teams (also known as complicated subsystem teams), there is often a 1:1 relationship between a team and its backlog. In contrast, for stream-aligned teams, a single backlog may span multiple parts of the system, reflecting their broader end-to-end responsibility. ↩︎
Author: Peter Vollmer – Last Updated on Oktober 16, 2025 by Peter Vollmer