
Every Department Tries to Win – and the Business Loses
In most organizations, people act rationally from where they stand: they pursue their department’s goals, protect its budget and headcount, and compete for priority and capacity. Each of these decisions makes sense locally, yet together they often produce a result that falls short. This article explains why a structure designed for functional departments, reinforced by departmental incentives, is one of the main causes of performance issues, and how designing for value creation and orchestrating the optimization of value streams and landscapes enables a high-performing business.
“I’ll talk about why everyone or everything in a system can act dutifully and rationally, yet all these well-meaning actions too often add up to a terrible result.” 1
Donella H. Meadows, Thinking in Systems
A Familiar Pattern
Most leaders in product development know the situation Meadows describes. Every department works hard. Some targets are met, others slip – yet the status reports show mostly green, whatever the actual situation. When an escalation does come, all departments are well prepared to show that it was not their fault.2
Yves Morieux describes where this leads: organizations put more effort into establishing who is to blame if they fail than into making success possible – they become “able to fail, but in a compliant way”.3
People follow the incentives they are given, and many look after their own advantage. The system rewards this. Those who serve their department’s goals, defend its budget and stay clear of blame are visible and successful, and over time they rise. Those who put the shared result ahead of their own position, help others and take on problems that are not formally theirs are less visible and more vulnerable to blame. In many organizations, promotion therefore follows political skill more reliably than contribution to the business. Those who rise this way then set the incentives for the next generation, and the pattern becomes a reinforcing loop.
Leadership often reinforces the pattern without intending to. Leaving each department its autonomy keeps responsibility clear: every department answers for its part. Governance across the departments – for the shared result, for the trade-offs between them and for the budgets that follow – is then left to the sum of the parts. A system does not steer itself, however. Deming described the consequence:
“Left to themselves […], components become selfish, competitive, independent profit centers, and thus destroy the system.”4
W. Edwards Deming, The New Economics
Better Starting Conditions
Meadows’ central point is that the structure of a system is the source of its behavior.5 Morieux looks at the same phenomenon from his angle: when people do not cooperate, the reason lies in their work situation – which often leaves them individually worse off if they do. Gene Kim and Steven Spear reach the same conclusion: leaders design the “social circuitry” of an organization – the processes, norms and routines that coordinate individual effort – and this wiring decides whether that effort adds up.6
The question is therefore how to build an organization with better starting conditions: one in which acting in one’s own interest also serves the whole, and in which the people who contribute most to the shared result are the ones who succeed.
Most development organizations are designed for functional departments. Departments are the unit of planning, budgeting, staffing and reporting, and for good reasons: they build expertise, develop capabilities and provide stability. Value creation and outcomes run across them. James Martin described the consequence three decades ago: functional organizations divide value streams into fragments that no one owns as a whole.7 Organizations compensate with coordination: project management offices, status reports and escalation paths. This pushes work through the system, inhibits flow and consumes a growing share of the effort – and the fragmentation remains.8
Better starting conditions turn this around. The following conditions describe an organization designed for value creation and outcomes.
The unit of design is the value stream. Departments remain the home of expertise and capability, while work is organized along the flow of value – what Mik Kersten calls the shift from functions to flow.9
Two perspectives complement each other. Kersten’s Outcome Tree starts from what is to be achieved: it arranges value streams and their sub-streams by their outcomes and gives each of them an owner and funding, and his shifts – from functions to flow, matrix to modularity, divisions to domains – set the direction for the structure. Value Stream Thinking works out how the work actually comes together and how to organize teams and ways of working around it. Its building block is the Convergence Unit: a unit that spans from a backlog to a validated result and is responsible for that result.
The design challenge lies here: which Convergence Units serve which node of the Outcome Tree, how they are cut for maximum flow, how large they should be and how they scale. The answers follow from the product, its architecture, its dependencies and the cognitive load a team can sustain – Designing Organizations Around Value describes how to reach them. Where a Convergence Unit exceeds a single team, it becomes a stable team of teams. AI-Native ARTs10 in SAFe are one way to implement this; other setups fit other contexts. When the work that must converge sits within one Convergence Unit, many interfaces disappear, and with them the coordination they require – as Morieux recommends. Results become attributable, and the question “why?” gets a factual answer. Responsibility for the shared result is clear, and contributions inside it can overlap. At scale, Convergence Units nest, each converging into the one above it. A value stream – and a landscape of value streams – is then built from units that own their results.
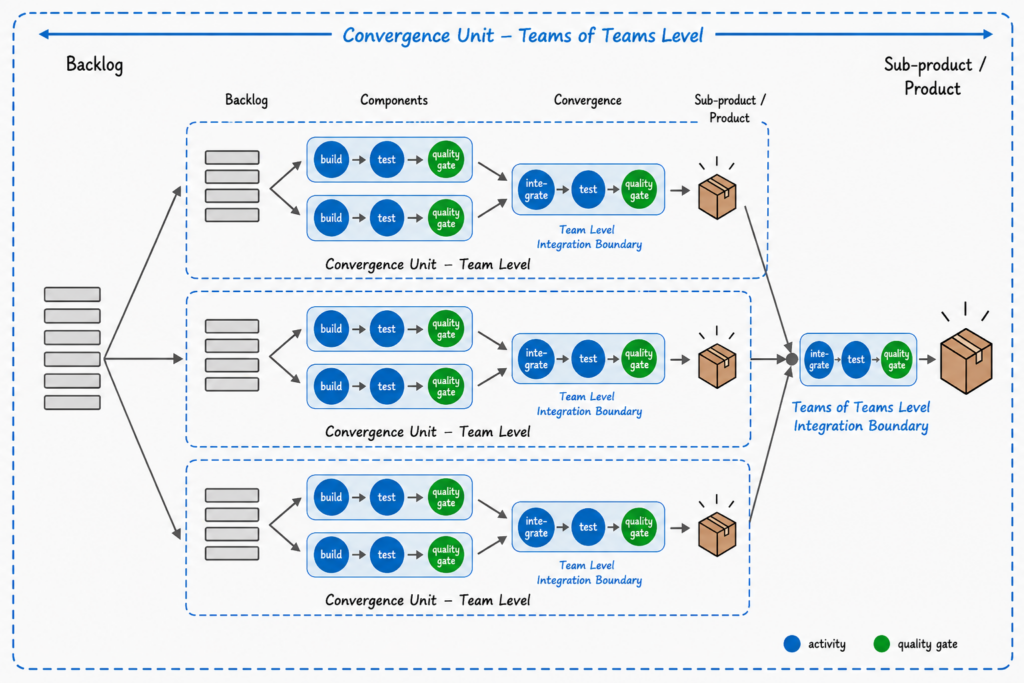
Capacity can follow the work. Capacity is allocated by outcome: the Outcome Tree assigns funding to the value streams, and within them each Convergence Unit prioritizes its work by the result it is responsible for. The precondition is team design. The Team as the Smallest Unit of Value Delivery describes the properties a team needs: one shared mission, cross-disciplinary capability, stability and manageable cognitive load. On this basis, a Convergence Unit lets capacity follow the work in three ways. T-shaped team members step into neighboring tasks – a capability that grows as stable teams learn each other’s domains. Pull lets work enter the unit at the rate it can be processed. And when work accumulates in one place, the unit moves its capacity there – within a team, and between the teams of a larger Convergence Unit.
Where departments own the capacity, priorities follow project budgets and the pressure of different stakeholders, and scarce experts become bottlenecks with queues in front of them.11
Goals are set for the result. The Outcome Tree defines the outcome of each value stream and sub-stream and steers it with OKRs: a consistent set flows down the tree, each node owns its OKRs, and outcomes are tracked back up. Value Stream Thinking translates them into goals for the Convergence Units that deliver the outcomes: the four Value Stream Performance Parameters – Time to Market, Productivity, Quality and Employee Engagement – are set together for each unit’s result, and the goals of nested units are aligned with the level above (Value Stream Measurement). Meadows ranks the goals of a system among its strongest leverage points, far above parameters such as targets and budgets.
Distributed across departments, the same parameters become competing goals: a validation department measured on quality extends test campaigns, a development department measured on time to market pushes for earlier hand-overs. Both act correctly against their goals and pull the value stream in opposite directions – the trap Meadows calls seeking the wrong goal. Within a Convergence Unit, speed and quality become one trade-off, decided by the people who see both sides of it.
Cooperation pays off individually. The Outcome Tree makes ownership explicit; Convergence Units make contributions visible: they deliver attributable results, and their teams share ownership of them. On this basis, recognition, budgets and promotions can follow the contribution to the shared result – including the help people give others and the problems they take on. Morieux’s conclusion is to design organizations in which cooperating becomes individually useful, and to look at how people contribute to the success of others.
Where incentives stay departmental, budgets and headcount are defended, scope is held, and priorities are negotiated in the department’s favor. Over time, departments grow into small kingdoms: well run on the inside, with clear borders and a natural interest in their own continuity. Local optimization within these borders can succeed, but its gains rarely last for the whole. When the people who contribute most to the shared result are also the ones who rise, the reinforcing loop described above starts working in the other direction.
The system is visible. Kersten’s Outcome Loop and Flow Metrics measure performance: how well value flows end to end and whether outcomes are achieved, for each node of the Outcome Tree. Aggregated at the level of a value stream, they do not show where in the flow the problems arise – a longer flow time can stem from late requirements, waiting at a hand-over or a slow integration stage. Value Stream Thinking adds this answer.
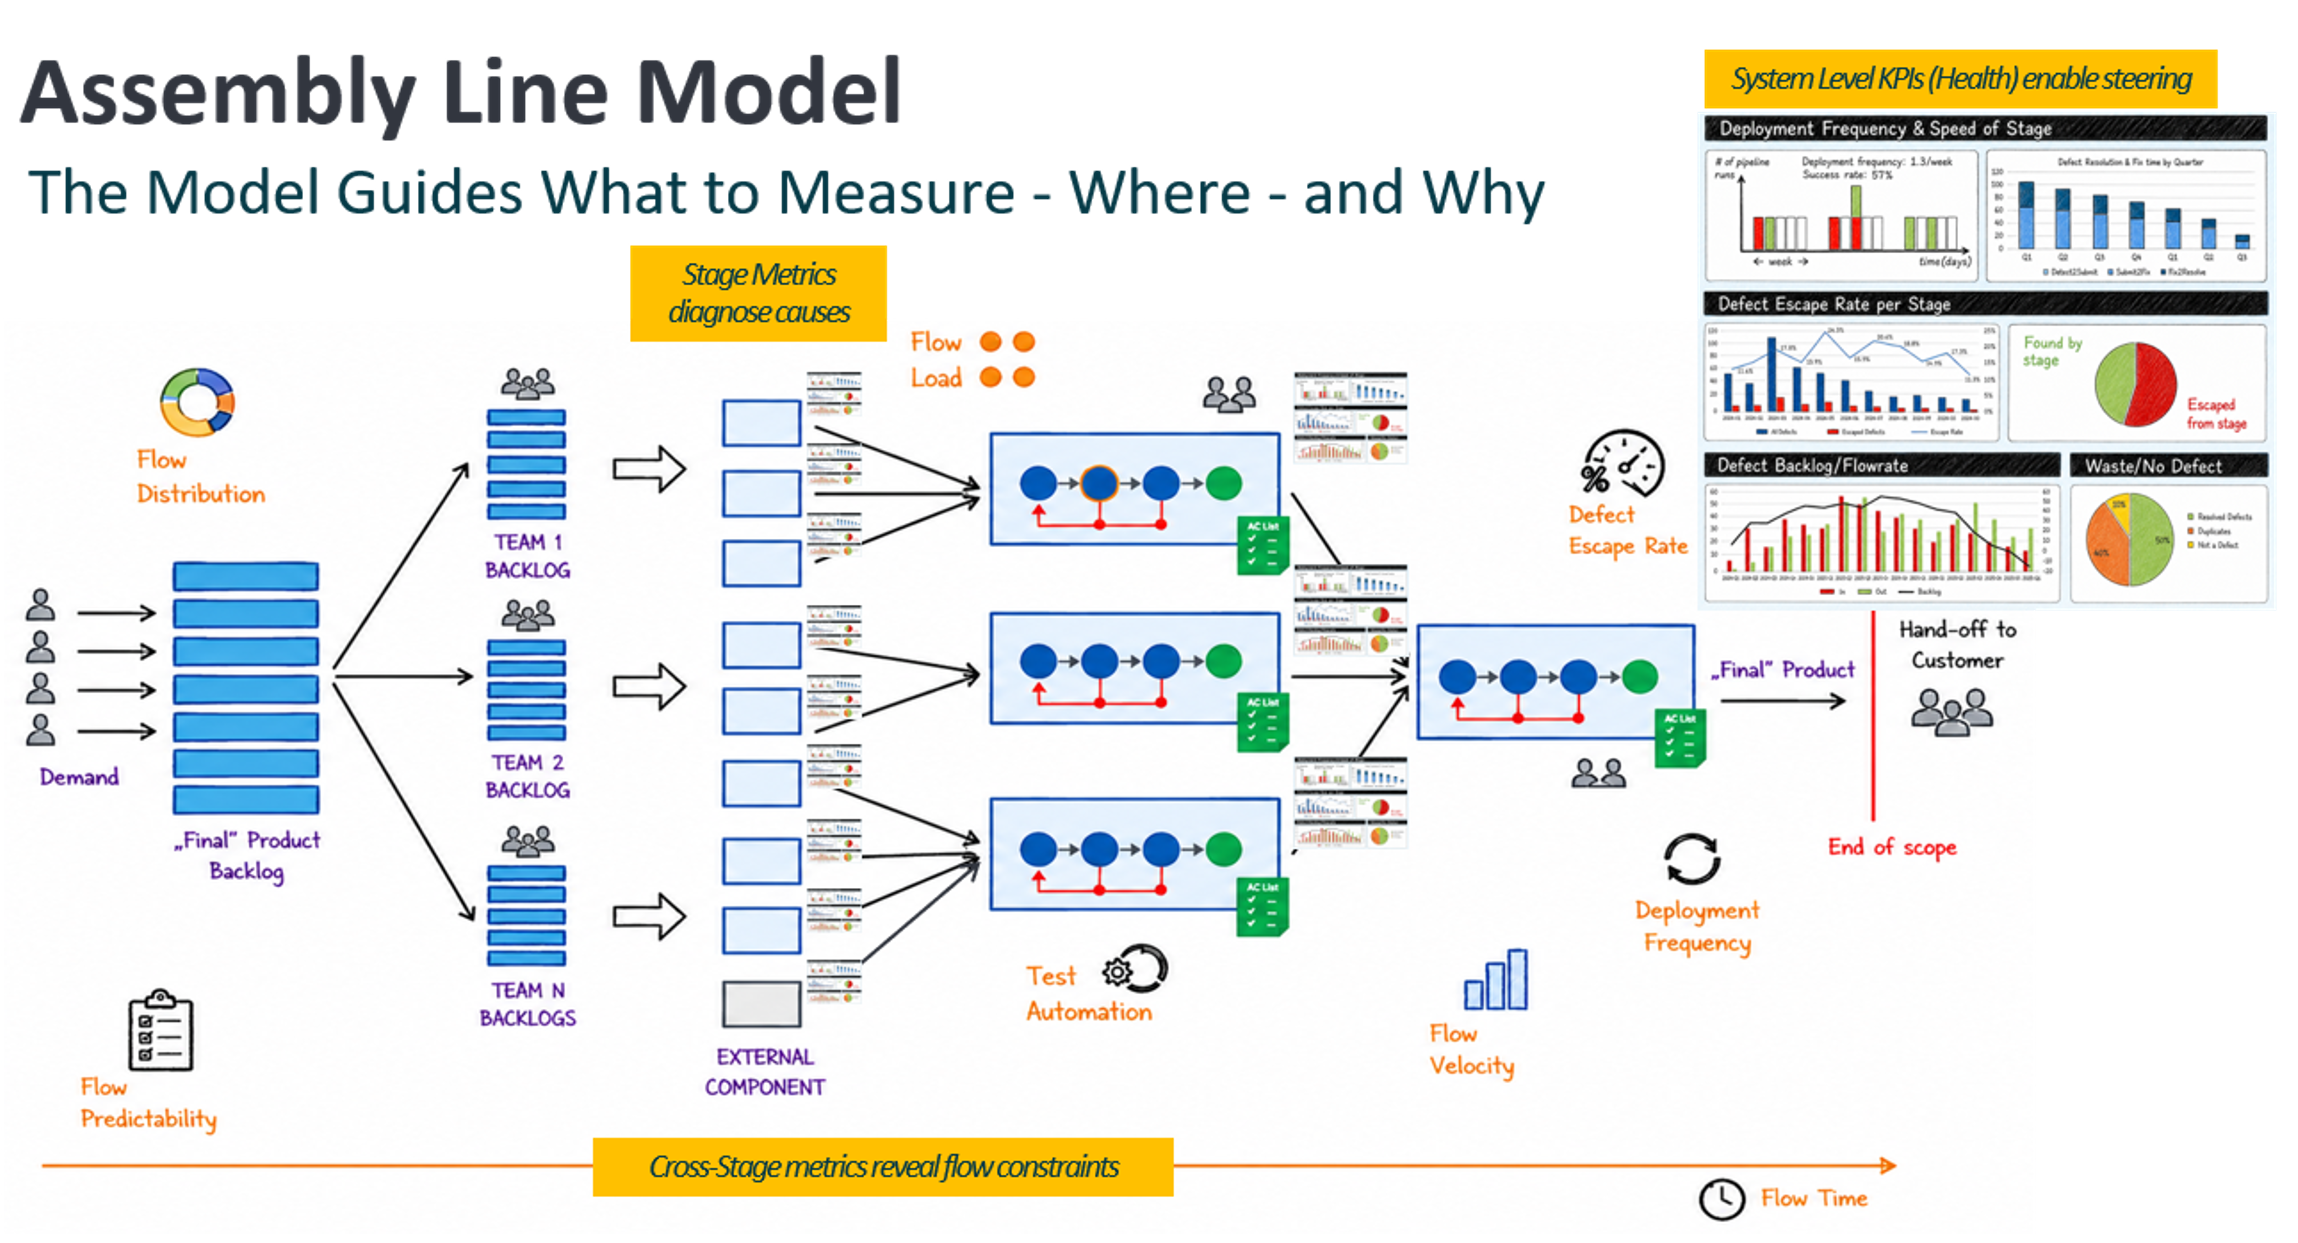
In the Assembly Line, metrics work as structurally placed observers: the model determines what to measure, where and why – at the stages, integration points and feedback cycles of every level, from a single Convergence Unit to the whole value stream (Metrics Guidance). System-level KPIs such as Flow Time, Deployment Frequency and Defect Escape Rate show the health of the value stream and enable steering. Cross-stage metrics reveal where flow is constrained. Stage metrics diagnose the causes. Because each Convergence Unit delivers a validated result at a defined point, its performance is observed exactly where it matters for the whole. Meadows counts information flows among the strong leverage points of a system.
Today, each department reports its own figures – mostly green – and each position sees only part of the picture. This is Meadows’ bounded rationality: Value Stream Identification describes how a component team sees its build, an integration lead what arrives late, a domain owner the escalations. Individual performance metrics add to this. Morieux recommends removing most quantitative metrics used to assess individual performance: people then put their energy into what can be measured about themselves – in his relay race, their own speed – at the expense of the hand-over, which no individual metric captures. Departmental metrics have the same effect one level up. Structurally placed observers measure the flow of the system, including the hand-overs between stages, so everyone sees the same problems – while they can still be fixed.
Some of these conditions can be improved within the existing structure. Others require what Martin called a break with the past: “Some changes, by their very nature, cannot be incremental. They need the introduction of a fundamental change – a break with the past.”12 Improvement within the existing setup moves the organization toward a local maximum. A different structure – organizing around value13 – moves it to a better starting point.
Building These Conditions With Value Stream Thinking
Value Stream Thinking provides the models and steps to transform the existing structure into a design for value creation that meets these conditions. It follows the three stages of the Value Stream Lifecycle and extends and connects them to landscapes for organizations with many value streams.

Identification makes the current structure and behavior visible. Structure shapes behavior, and both stay hidden as long as each position sees only its part. Value Stream Identification makes them visible together: the Value Stream Canvas bounds the system, the Assembly Line describes its structure, and the Issues & Findings List records its behavior – each finding anchored to the point in the structure where it occurs. This turns a list of complaints into a diagnosis. The model is built with people from across the stream. The guiding question is where failure is already built in: integration points without a Convergence Unit, capacity locked into departments, goals that pull in opposite directions and many more.
Design and decide. Future-state options are structural hypotheses – this structure will produce that behavior. Each option places integration boundaries with the four lenses of Designing Organizations Around Value, defines the Convergence Units within them and composes their teams as the smallest unit of value delivery. The options are assessed against the Issues & Findings List and decided in a Decision Meeting (How to Start). This is where the break with the past happens.
Move in steps. For each value stream, a roadmap leads to the break with the past: the new structure is prepared, decided and put in place. Not all value streams can make this break at once, so the landscape changes incrementally. The Transformation Landscape sets the sequence and makes the intermediate states visible: for a while, departmental structures and value streams coexist. Funding, goals and recognition have to change together with the structure. Where they stay departmental, the old incentives hold the old structure in place.14
Improve and steer. Once the new setup is in place, Value Stream Optimization Leads use the structurally placed observers to find where flow breaks and to prepare decisions on evidence (Assembly Line for Value Stream Optimization). Observability itself improves step by step – the better the organization sees, the better it can act. Across value streams, the Performance & Observability Landscape makes results comparable, so that conflicts between them can be decided on shared data.
Scale. In large organizations, a global path builds the Value Stream Landscapes top down, while local identifications create insight and early results bottom up. The two meet in the middle (Working with Large & Complex Value Streams).
These conditions come with their own trade-offs.15 Shared components often serve several Convergence Units at once; their owners face competing requirements and capacity demands, and someone has to decide between them. A Convergence Unit that grows too large reproduces the coordination problem inside its own boundary. And deep expertise still needs a home: departments keep their role in capability development and standards. Every design remains a hypothesis that has to prove itself in flow, quality and engagement.
AI Amplifies the Structure It Meets
AI speeds up individual activities: code, tests, documentation and analyses are produced faster. Kersten draws the consequence for the age of AI: the constraint shifts from producing outputs to delivering outcomes. In a structure designed for value creation, AI agents work within the Convergence Unit that owns the result – as part of a team or as a sub-unit of their own, while responsibility for the result stays with people. The unit decides where AI helps the shared outcome most, and structurally placed observers show where the faster output gets stuck – so that capacity, including AI capacity, can follow the work.
In a structure designed for functional departments, each department naturally applies AI to its own targets first. The faster departments push more work into interfaces that have not changed. Queues grow at the integration points, downstream departments come under more pressure, and the competition for priority and capacity intensifies. From AI Potential to Product Outcomes describes this with an example: one team produces changes faster than other streams can integrate them, and local productivity rises while unfinished work accumulates. AI also makes status reports cheaper to produce. Used this way, it enlarges the world of reports without bringing a decision any closer.
Martin observed the same pattern with earlier computerization: companies automated existing processes and kept structures designed for an earlier era. AI puts organizations in front of the same choice. Applied department by department, it makes local optimization faster and lengthens the queues at the integration points. Its potential for the value stream as a whole unfolds only where the structure lets the faster work converge.
Questions for Leaders
The following questions help test whether structure, incentives and steering are designed for value creation:
- Is value stream governance anchored at the level where budgets and goals are decided?
- Where in our structure is failure already built in – where does work cross departmental boundaries without anyone owning the result?
- Who is responsible when the value stream as a whole does not deliver, even though every department reports green?
- How are work and scarce expertise prioritized – by the outcome of a value stream, or by project budgets and stakeholder pressure?
- Are goals set for the result of a value stream, or distributed across departments?
- Who gets recognized and promoted – those who contribute most to the shared result, or those who navigate the politics best?
- Which figures does leadership look at: departmental reports, or flow and quality at the stages and integration points of the value stream?
- When something goes wrong, do our mechanisms help us find the cause, or mainly the department to blame?
Each answer points to a lever. Where the answers end at departmental boundaries, the structure will keep producing the familiar pattern, however committed the people in it are.
Conclusion
Meadows and Morieux arrive at the same diagnosis from different directions. People act rationally in the system they are given, and the result still falls short, because structure and incentives make that result likely. A structure designed for functional departments implies failure before the work begins; incentives built on departmental results and on blame make defending against it the rational choice – and promote those who play this game best.
Better starting conditions reverse this. Value Stream Thinking provides the models and steps to build them, complementing Kersten’s Outcome Tree with the detailed design of how the work comes together. AI makes the choice more urgent.
Local optimization will continue to produce local successes. A high-performing business needs structure and incentives designed so that each department’s interest and the shared interest point in the same direction. Then every department can still try to win – and the business wins with it.
Notes and References
- Meadows, D. H. (2008). Thinking in Systems: A Primer (D. Wright, Ed.). Chelsea Green Publishing. ISBN 978-1-60358-055-7. Introduction, p. 5 ↩︎
- Ron Westrum’s typology of organizational cultures describes this pattern. In pathological, power-oriented cultures, messengers are “shot” and failure leads to scapegoating; in bureaucratic, rule-oriented cultures, messengers are neglected and failure leads to justice; in generative, performance-oriented cultures, messengers are trained and failure leads to inquiry. His description of the bureaucratic type matches the departmental pattern in this article: alignment with one’s own unit or function replaces alignment with the mission, and departmental interests are pursued even at the expense of the mission. Leaders shape this culture through rewards and punishments – people who follow their preferences are rewarded, the others are sidelined (p. ii23). In Accelerate, Forsgren, Humble and Kim found that a generative culture predicts software delivery performance, organizational performance and job satisfaction. They add that bureaucracy is not bad in itself – the problem arises where following rules matters more than the mission – and that culture changes through changed practices: Lean management and continuous delivery measurably improved it (Chapter 3).
Westrum, R. (2004). A typology of organisational cultures. BMJ Quality & Safety (formerly Quality and Safety in Health Care), 13 (Suppl. 2), ii22–ii27. https://qualitysafety.bmj.com/content/13/suppl_2/ii22
Forsgren, N., Humble, J., & Kim, G. (2018). Accelerate: The Science of Lean Software and DevOps. IT Revolution. ↩︎ - Yves Morieux, TED Talks: How Too Many Rules at Work Keep You from Getting Things Done, https://www.youtube.com/watch?v=t__NoFstCmQ ↩︎
- Deming, W. E. (1993). The New Economics for Industry, Government, Education. MIT Center for Advanced Engineering Study. Chapter 3, “Introduction to a System”. The omitted words are “in the Western world”. The Scaled Agile Framework quotes the same passage in Principle #2, “Apply systems thinking”.
– Scaled Agile Framework: Apply Systems Thinking
– https://wist.info/deming-w-edwards/42891/ ↩︎ - Meadows (2008), see note 1. Chapter 4, “Why Systems Surprise Us”, section “Beguiling Events”, p. 89. ↩︎
- Kim, G., & Spear, S. J. (2023). Wiring the Winning Organization: Liberating Our Collective Greatness through Slowification, Simplification, and Amplification. IT Revolution. Kim and Spear distinguish three layers of a sociotechnical system: the technical objects, the tools used to work on them, and the social circuitry that coordinates people (Part I, “A New Theory of Performance Management”). Two of their three mechanisms correspond closely to the conditions in this article: simplification – incrementalization, modularization and linearization – to Convergence Units with deliberately placed boundaries (Part III); amplification – surfacing small problems early – to a visible system, and the opposite of mostly green status reports (Part IV). ↩︎
- Martin, J. (1995). The Great Transition: Using the Seven Disciplines of Enterprise Engineering to Align People, Technology, and Strategy. AMACOM. ↩︎
- Project Management Offices are a typical example. Their intent is to create transparency and keep projects on track. In practice, they often act as watchdogs: they increase the pressure on the people doing the work and request status reports that take time away from the work itself. Over time, a part of the organization lives largely in the world of status reports, adding little to the product and discussing figures whose origin and reliability are hard to judge – the map is not the territory, as Alfred Korzybski put it. Organizing Around Value describes this shift from coordination to pressure amplification. Morieux describes the same dynamic (see note 3). In the name of clarity and accountability, organizations keep adding interfaces, middle offices and coordinators; each of them ties up people and resources and creates new obstacles. As the organization grows more complicated, it becomes harder to see what is actually happening, and summaries, reports, KPIs and metrics take the place of direct insight. When performance deteriorates, the response is more structure, process and systems – a reinforcing loop. In BCG’s analyses, teams in such organizations spend 40 to 80 percent of their time on activities that add little value. Morieux’s relay race makes the point: a dedicated athlete made accountable for passing the baton creates a clear interface and a clear line of accountability, and the team loses the race. Designing Organizations Around Value illustrates the structural alternative: if someone on the second floor has to hand off work to someone on the fourth floor, adding a coordination process or a coordinator is rarely the right answer. Placing both on the same floor makes the hand-off – and the overhead around it – disappear. Morieux’s recommendation points the same way: remove interfaces, middle offices and complicated coordination structures. ↩︎
- Kersten, M. (2026). Output to Outcome: An Operating Model for the Age of AI. IT Revolution. Outcome Loop: Chapter 2. Outcome Tree: Chapter 3. Functions to Flow: first of the seven shifts.
OKRs in the Outcome Tree: see also the summary of Kersten’s keynote in “How to Build an Outcome Tree That Actually Drives Product Decisions”, Planview Blog, https://blog.planview.com/how-to-build-an-outcome-tree-that-actually-drives-product-decisions/ ↩︎ - Scaled Agile, Inc. “AI-Native ART” ↩︎
- Mik Kersten argues that funding software work as projects is a major reason why digital transformations fail to deliver business results [a]. A project is funded for a fixed scope and period, staffed for that time and judged by whether it delivers on time, on budget and on scope. When it ends, the team and much of its knowledge disperse, and the next project competes again for the same people. Kersten proposes funding long-lived product value streams instead and judging them by flow and business results. In the terms of this article, project funding ties capacity to departmental budgets, while funding per value stream lets capacity follow the work. Kersten continues this line in Output to Outcome (2026) with the shift from Functions to Flow.
[a] Kersten, Mik. Project to Product: How to Survive and Thrive in the Age of Digital Disruption with the Flow Framework. IT Revolution, 2018. ↩︎ - Martin (1995), see note 7. Chapter 18, “TQM vs. Revolution”, p. 251. ↩︎
- The idea is older than its current label. Michael Hammer’s first principle of reengineering was “Organize around outcomes, not tasks” [a]. James Martin made the value stream the unit of enterprise design [7], and Lean Thinking made it the starting point for improvement [b]. The Scaled Agile Framework (SAFe) organized Agile Release Trains around value streams before it named “Organize around value” as Principle #10 in SAFe 5.0 (2020) [c]. SAFe combines a stable hierarchy with a value-stream network in a “dual operating system”, a concept from John Kotter [d], and its Lean Budgets fund value streams instead of projects – the funding side of the conditions described here. An Agile Release Train can implement a Convergence Unit that spans several teams; whether a train and a Convergence Unit coincide is a design decision derived from the products, architecture and dependencies involved (see From AI Potential to Product Outcomes).
[a] Hammer, Michael. “Reengineering Work: Don’t Automate, Obliterate.” Harvard Business Review 68, no. 4 (July-August 1990): 104-112.
[b] Womack, James P., and Daniel T. Jones. Lean Thinking: Banish Waste and Create Wealth in Your Corporation. Simon & Schuster, 1996.
[c] Scaled Agile, Inc. “Principle #10 – Organize around value”, https://framework.scaledagile.com/organize-around-value, and “Lean Budgets”, https://framework.scaledagile.com/lean-budgets.
[d] Kotter, John P. Accelerate: Building Strategic Agility for a Faster-Moving World (published internationally as XLR8). Harvard Business Review Press, 2014. ISBN 9781625271747. ↩︎ - Value stream governance has to be anchored at the level where budgets are decided. In large organizations, this is the portfolio level, where Working with Large & Complex Value Streams places the central orchestration of value streams. Where governance sits lower, the new structure keeps running on project budgets, and departmental behavior returns. If the transformation starts on the local path, below that level, the funding dependency belongs on the Issues & Findings List from the start, with a sponsor who takes it to the level that decides budgets. ↩︎
- In my experience, this is where the success of a redesign is decided: in how these trade-offs are resolved in the specific context of products, architecture and people. That takes experience across many organizations and value streams. As How to Start recommends for the first identifications, the design should therefore be guided by an experienced Value Stream Thinking expert – internal or external – who also builds the organization’s own capability along the way. ↩︎
Author: Peter Vollmer – Last Updated on October 16, 2026 by Peter Vollmer