What Has Evolved in Value Stream Thinking
Value Stream Thinking has always been shaped by two things: what happens in real value streams, and what the research on flow, systems, and organizational design already tells us. Over the past months both have pushed in the same direction, and the site now reflects that.
None of what follows replaces earlier material. The Assembly Line Model, the Value Stream Lifecycle, and the case for organizing around value all stand. What has changed is that several ideas that were implicit in practice are now explicit in the corpus, and a few concepts that had no name have one.
This post walks through the five most substantial developments and points to the articles where each is now described. It closes on the thread that is still being worked out.
1. A sharper account of what VST actually is
For a long time the site was clearer about what Value Stream Thinking rejects – linear mapping, manufacturing metaphors applied to product development – than about what it consists of.
It now says so directly. Value Stream Thinking is applied Systems Thinking, with Assembly Line modeling at its core, and it connects four recurring moves held together by a shared intent: faster, high-quality value delivery and quicker response to change.
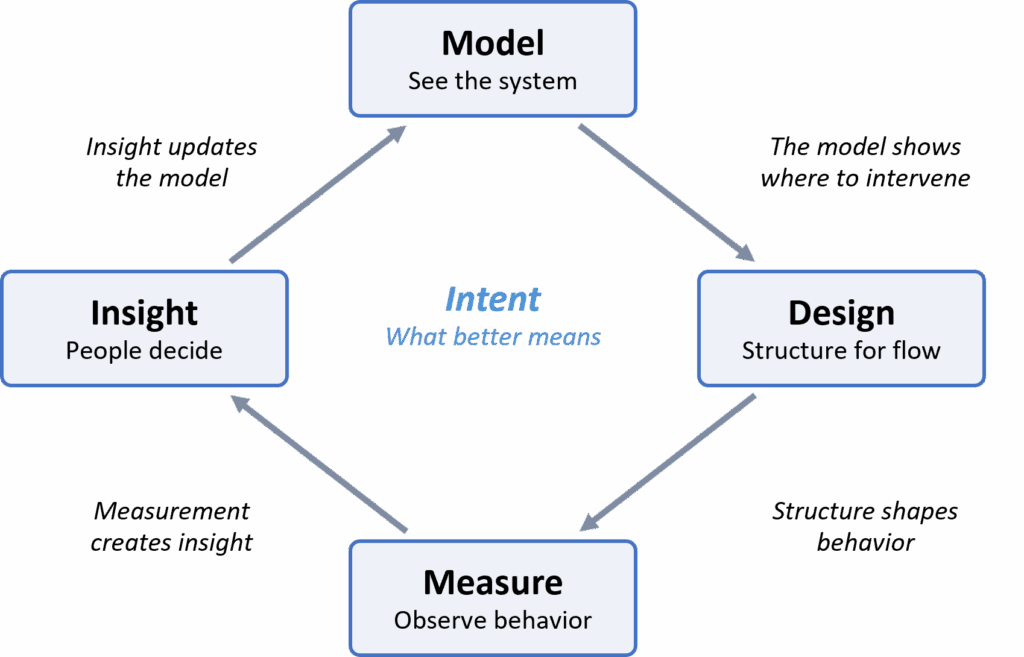
- Model to make the system visible. The model shows where work flows, where it waits, where it converges, and where feedback cycles close – and therefore where delays accumulate and defects escape.
- Design the structure to enable flow. Organizing around value reduces unnecessary coordination and hand-offs – because structure shapes behavior.
- Measure to increase observability. Measurement quantifies what the model locates. And because it runs continuously, it shows how the system evolves rather than how it looked on the day it was modeled.
- Turn insight into change. Evidence is interpreted, insight emerges, and people decide how to intervene – by changing the value-creation system, refining the model or the measurement system, or combining these actions.
The four moves form a learning loop, not a rigid sequence. They relate to the three stages of the Value Stream Lifecycle – Identification, Organizing Around Value, and Systematic Improvement – but not one-to-one. The stages describe where the emphasis lies during a given period; the moves keep interacting across successive learning cycles.
That distinction matters more than it looks. It resolves a tension the body of work carried for a while: the lifecycle reads as a progression, while real improvement work is plainly iterative. Both are true, at different levels of description.
2. Structure and behavior, stated plainly
The strongest theoretical addition is also the simplest. Donella Meadows puts it this way:
“Once we see the relationship between structure and behavior, we can begin to understand how systems work, what makes them produce poor results, and how to shift them into better behavior patterns.” 1
This is not decoration. It is the explanation behind claims the site had been making for some time without fully grounding them.
Every Value Stream Identification starts from something concrete. Often it is behavior: lead times that are too long, integration problems that surface late, quality issues that appear only at the end. Just as often it is a pending change to the structure itself – a reorganization, an architectural shift, a new technology, a merger – where the question is not what went wrong but what the new arrangement will produce.
Both lead to the same place. Behavior is produced by the way the system is structured. The difficulty is that structure is not visible: the organizational chart shows reporting lines, not the flow of value; process descriptions show intended sequences, not the dependencies, queues, and feedback loops that actually determine behavior. Everyone experiences the behavior. What produces it stays hidden.
That is why identification begins with a model, and it is also why the difference between a local and a global optimum is not a matter of ambition. Continuous improvement changes behavior within a given decomposition of work and its integration points, so it can only reach the ceiling that structure permits. Organizing around value changes that decomposition and those integration points. Different curve entirely2.
3. What a value stream is – restated
The definition of a value stream has been rewritten. It also moved: it used to sit in the identification article, where it was doing double duty as an introduction.
Two changes matter.
The first is the list of what a value stream comprises. It now reads: people, AI agents, organizational structures, processes, information, technologies, and coordination mechanisms. Agents appear as actors rather than as tooling, because that is what they are becoming. A model that files them under technology puts them next to the work instead of in it.
The second carries further. The definition now states what those elements amount to: “These elements do not merely support the flow; together, they form the value-creation system3 and shape how it behaves.”
That is the previous section’s claim, moved inside the definition. Structure is no longer something argued for in one article and assumed in the others. It is part of what a value stream is.
Three smaller changes point the same way. The lifecycle span now explicitly includes the feedback needed to establish whether the intended value was realized, not only the work of producing and delivering it. Recursion is stated in the definition rather than left to the sub-stream section. And the whole thing is decomposed into six facets, each answering a question: why the stream exists, how far it extends, what is inside and outside, what makes the flow possible, what kind of flow it is, and how it relates to larger and smaller streams. A definition you can agree with is worth less than one you can scope with.
Everything else followed. Concepts and Definitions is now the canonical reference for VST terminology – value streams, sub-streams, landscapes, the operational, development, and domain classification, the nested and networked relationship patterns, and the Convergence Units of the next section. Other articles point to it rather than restating. That is partly housekeeping, but a shared vocabulary needs one place where terms are defined against each other, not several places where each is defined in isolation.
4. Convergence Units – a name for the building block
The structure is not new. The Assembly Line Model has drawn it from the start: a backlog, decomposition into components, integration, a quality gate. What is new is that it now has a name, a defined upstream end, and a normative status – and that combination has wider consequences than anything else on this list.
A Convergence Unit is the structure that spans from a backlog to the convergence of the work that backlog produced. A backlog defines what is to be built; the work is decomposed into components developed in parallel; those components are integrated; a quality gate validates that what the backlog committed to has been correctly implemented and integrated. The result is a validated output the next level can pull. Backlog and convergence are not two attributes among several. They are the two ends that define the unit, and everything between them lies inside it.4
An Integration Boundary is the boundary of a Convergence Unit – the line separating work that converges within the unit from work coordinated across it. Within it, teams collaborate continuously, integrate frequently, and resolve issues locally. Across it, interaction occurs through stable interfaces and defined handovers. The two terms describe the same structure from different perspectives: the Integration Boundary is the design decision, the Convergence Unit is the operating entity that hands over a result and can be held responsible for it.
Two properties make this more than terminology.
It is recursive. Where a backlog’s scope exceeds what a single team can sustainably understand and evolve, it is decomposed into further backlogs, each producing its own components and its own convergence. Cascading backlogs and cascading Integration Boundaries are the same structure seen from either end. The pattern – backlog, decomposition, component development, integration, quality gate – is identical at every level; only the scope of the work and the scope of validation change. This is what makes Convergence Units usable as the building blocks of organizational design rather than as a description of one team.
It is normative. Convergence happens in every value stream whether or not anyone designed for it. An Integration Boundary exists only where that convergence has been deliberately contained: where a backlog is scoped to the level at which work converges, and where responsibility for the validated result is clear. Where those conditions are absent, the system has integration points but no Convergence Units. A real-world structure may resemble one without qualifying as one. Current-state models describe integration points; Convergence Units belong to the target state.
The practical payoff is attribution. A Convergence Unit produces an observable result at a defined point, and that result can be compared against what the unit committed to deliver. Where convergence is not contained, end-to-end signals can still show that a value stream is underperforming, but they cannot reliably indicate where the problem originates. That is the difference between health monitoring and diagnosis.
→ Concepts and Definitions · Designing Organizations Around Value
5. Where feedback cycles close, and the two levers
The site has long described how feedback cycle times lengthen from left to right, and which defect types each stage can realistically detect. What it did not say was why the cycles have the lengths they have.
They close where work converges. Components close their loops at the integration points where they come together. A Convergence Unit closes its loop at its quality gate. Where backlogs cascade, further loops run between them, resolving alignment before any integration occurs. Below all of this, cycles close inside a single activity, with static analysis and unit tests running as code is written.
So a loop that closes within a team is fast and one that closes across three organizations is slow – not only because later validation is technically heavier, but because the convergence it validates spans a wider organizational structure.
That gives two levers for shortening feedback, and they are not interchangeable:
- Within a given boundary – faster feedback comes from tooling, automation, and test strategy: what is tested, when, and against which representation of the surrounding system. This is what shift-left addresses.
- By moving the boundary – work that must converge frequently is placed inside a stable unit rather than coordinated across organizational lines. This is what organizing around value addresses.
The two are often confused in practice. Where a team pre-integrates against stubs or the last known good version of its neighbors, it is using the first lever to compensate for the second: the boundary has not moved, so the loop closes sooner but against a stand-in. That is worth having for everything the stand-in can represent, and silent about everything it cannot – above all the defects that appear only when concurrently changing components meet, which escape to the later convergence anyway. Sustained investment in surrogates is therefore a useful signal in itself. It usually means convergence is happening further away than the team can work with.
→ Feedback Cycle Times and Defect Types · Assembly Line Optimization
6. What is evolving now: optimization as a spiral
One thread is still being worked out, and it is worth naming because it changes how the whole lifecycle should be read.
Organizations do not begin with a complete model or reliable performance data. The first turn works from a good-enough model and qualitative Issues & Findings – dependencies, delays, handovers, recurring problems – because that is what a first structural decision needs.
Drawing the system boundary already buys something: with a defined start and end, the value stream can be measured end to end, which shows whether it is healthy. What it does not show is where a problem originates. That takes internal structure. A contained convergence produces a validated result at a defined point, and that point is where a measurement can be placed. Structure is what creates the places worth measuring. Only then does quantitative evidence become worth gathering.
So the loop is not the same size every time. It expands. Each turn improves the model, the evidence, and where the findings warrant it the structure, while strengthening the organization’s ability to see, understand, and deliberately improve its own system.
So the loop is not the same size every time. It expands. Each turn improves the model, the evidence, the structure, and the organization’s ability to see, understand, and deliberately improve its own system.
A spiral describes this better than a circle. And learning within it is not strictly sequential: a measurement anomaly can reveal that the model is wrong, a workshop can expose a dependency nobody had drawn, an incident can surface a missing stage. Findings enter from many directions.
That is the next piece of writing. If you are working with this in practice, particularly on the question of how much modeling is enough to support a first structural decision, I would be interested to hear how it plays out in your context.
Notes and References
- Meadows, D. H. (2008). Thinking in Systems: A Primer (D. Wright, Ed.). Chelsea Green Publishing. Meadows argues that the structure of a system generates its patterns of behavior, and that understanding this relationship is what makes deliberate intervention possible: “Once we see the relationship between structure and behavior, we can begin to understand how systems work, what makes them produce poor results, and how to shift them into better behavior patterns” (Introduction). Structure in this sense is not the organizational chart. It includes integration points, dependencies, delays, information flows, policies, and feedback relationships – which is precisely what the Assembly Line makes visible, and why it cuts across organizational hierarchies rather than following them. ↩︎
- The image is an improvement curve: performance against time or improvement effort. Continuous improvement follows a curve that approaches an asymptote, and that ceiling is set by the existing decomposition of work and its integration points. Changing those conditions replaces the curve rather than reaching a higher point on it. Developed at greater length in Value Stream Identification, where the same argument is made through the image of two summits. ↩︎
- Introducing this term raised a question that came up while reworking the definition, and it is worth stating rather than settling quietly. Value stream names what is scoped: a trigger, a customer, an outcome, a system boundary. Value-creation system names what is inside that scope and produces its behavior. Given recursion, convergence, and feedback loops, the second arguably describes the object more accurately than the metaphor of a stream does; the first carries the scoping discipline that makes modeling possible at all. Both are in use, and where each belongs is still being worked out. ↩︎
- Nesting is the simplest case. In complex products, Convergence Units can also overlap: where several functions or subsystems are realized from the same components, a component contributes to more than one convergence, and the units containing it no longer stack cleanly. The structural and behavioral consequences – for boundary placement, ownership, and attribution – will be explained in later work. ↩︎